Monthly Newsletter - April 2025
|
Discover the latest platform news, including powerful new updates on Historical AIS on Maps, Bulk Vessel Updates in Vessel List, MED Becomes a SECA Zone, and Floating Storage Report (Clean Products Focus) —plus key highlights on Dry and Tanker market dynamics.
|
|
|
You can now explore past voyages visually across Maps with our new Historical AIS Track feature. View vessel position, speed, draught (%max draught), direction, and more — at 2-hour intervals — for any completed voyage. Available for both Tanker and Dry modes on Vessels Dashboard, this gives you more precision and context in your route analysis.
|
|
Floating Storage Report – Clean Products Focus
|
The new Product tab in the Floating Storage report is now live, offering targeted insights for Fuel Oil and Clean cargoes. Commodity users can now track floating volume trends across all cargo types and regions, with flexible controls for minimum stationary days, live vs historical views, and enhanced maps. A valuable addition for anyone monitoring clean product movements.
|
|
|
Bulk Vessel Updates Made Easy
|
Managing your Vessel Lists just got faster. You can now add multiple vessels in one go by simply pasting IMOs, and bulk update tags to keep your lists organised with minimal clicks. These enhancements help streamline your workflows and reduce repetitive tasks.
|
|
Starting May 1st, the Mediterranean Sea will be treated as a Sulphur Emission Control Area (SECA). Our Voyage Calculator and Distance Tool now automatically factor this into emission and fuel calculations. Maps also clearly display the new SECA zone to support accurate planning.
|
|
|
Supramax Market Analysis: S8 Route
|
Over the past several weeks, the Supramax freight market has witnessed a remarkable recovery, particularly on the Baltic Exchange’s S8 route — which covers South China via Indonesia to East Coast India, a key corridor for coal shipments.
|
|
|
|
Escalation of U.S.-China Trade Tensions
|
On April 4th, China announced a 34% tariff on all U.S. imports, a retaliatory response to recent U.S. protectionist trade measures, effective April 10th. This escalation in the trade dispute is set to have a direct impact on key U.S. dry bulk exports—particularly soybeans and corn—based on recent cargo flow and vessel deployment data from the Signal Ocean Platform and supporting trade intelligence.
|
|
|
|
March 2025 Spike in Aframax Voyages to the Far East
|
Updated voyage data from Signal Ocean shows that Aframax tanker shipments from Russia’s Pacific ports to the Far East saw a notable month-over-month increase in March 2025, despite a slight year-over-year decline compared to March 2024.
|
|
|
|
Shift in Global Soybean Trade Flows
|
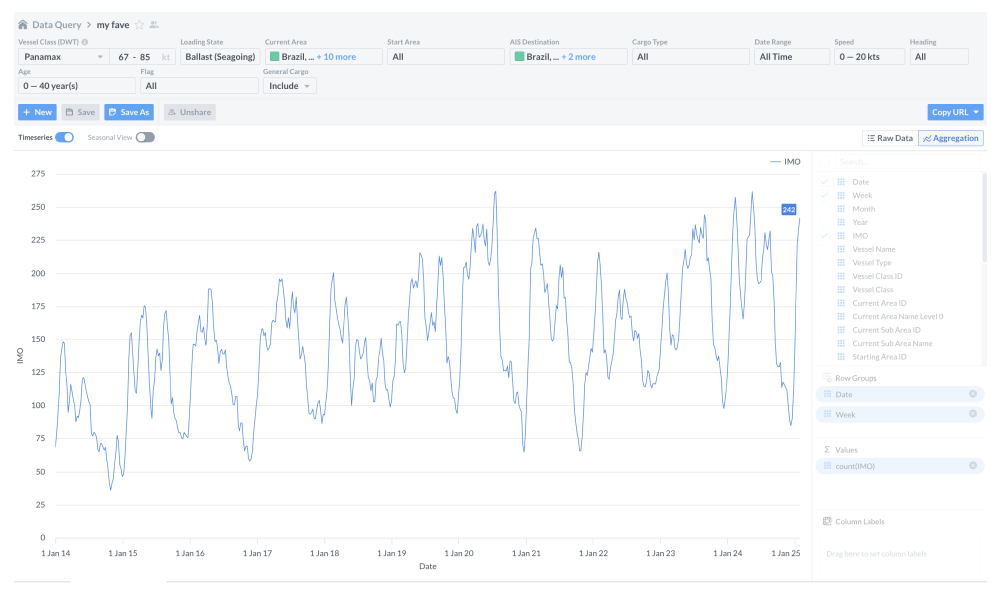
A clear structural shift in the global soybean trade, underscoring China’s increasing reliance on Brazilian imports. In recent years, Brazil has steadily emerged as China’s primary soybean supplier—a trend closely tied to broader macroeconomic dynamics, notably the ongoing trade tensions between the United States and China.
|
|
|
|
China's dry bulk import profile
|
The first quarter of 2025 has shown mixed signals in China's dry bulk import profile, reflecting commodity-specific trends and the broader strategic shifts underway amid the U.S.-China trade war.
|
|
|
|
Iran sustains significant crude oil exports
|
A striking feature of Iran’s export strategy is its overwhelming reliance on Kharg Island, which accounted for 96.6% of all shipments and 95.3% of terminal usage during this period. These figures highlight the island’s pivotal role in Iran’s oil logistics infrastructure and its strategic value in sustaining flows amid sanctions.
|
|
|
|
Thank you for catching up with the latest from Signal! Stay tuned for more updates, insights, and tools. Click here to download this newsletter.
|
|
|
© 2025 The Signal Group. All Rights Reserved.
|
|
|
|