


drives these stories

There is no doubt that 2020 has been a turbulent year for commercial shipping. The coronavirus pandemic has shaken the global maritime transport. The pandemic waves have disrupted supply chains and cargo flows across the world. Global oil demand was severely hit. Tensions and disagreements regarding oil production between the Organization of the Petroleum Exporting Countries (OPEC) and its allies such as Russia (known as OPEC+) exacerbated the oil supply-demand imbalance. All of a sudden, the world was flooded with oil and was running out of place to put it leading to a spike in demand for tankers that served as floating storage. While this sparked some good news for the tanker market, when the floating storage boom ended, the freight rates plummeted. As the end of the year draws near, we reflect on the sunny moments of the commercial shipping industry, the stormy moments, and all things in between.
How the shipping industry responded to a highly volatile year
The coronavirus pandemic caused a major disruption across the global economy. The collapse in oil demand and new lockdowns imposed by countries led to an immensely volatile year for the shipping market. Here is our market analysis based on The Signal Ocean Platform using Signal Maritime’s data. We will take a look selectively at a range of vessel segments and regions covering Crude Tankers, Product Tankers as well as Dry vessels.
Dirty Tankers – VLCCs

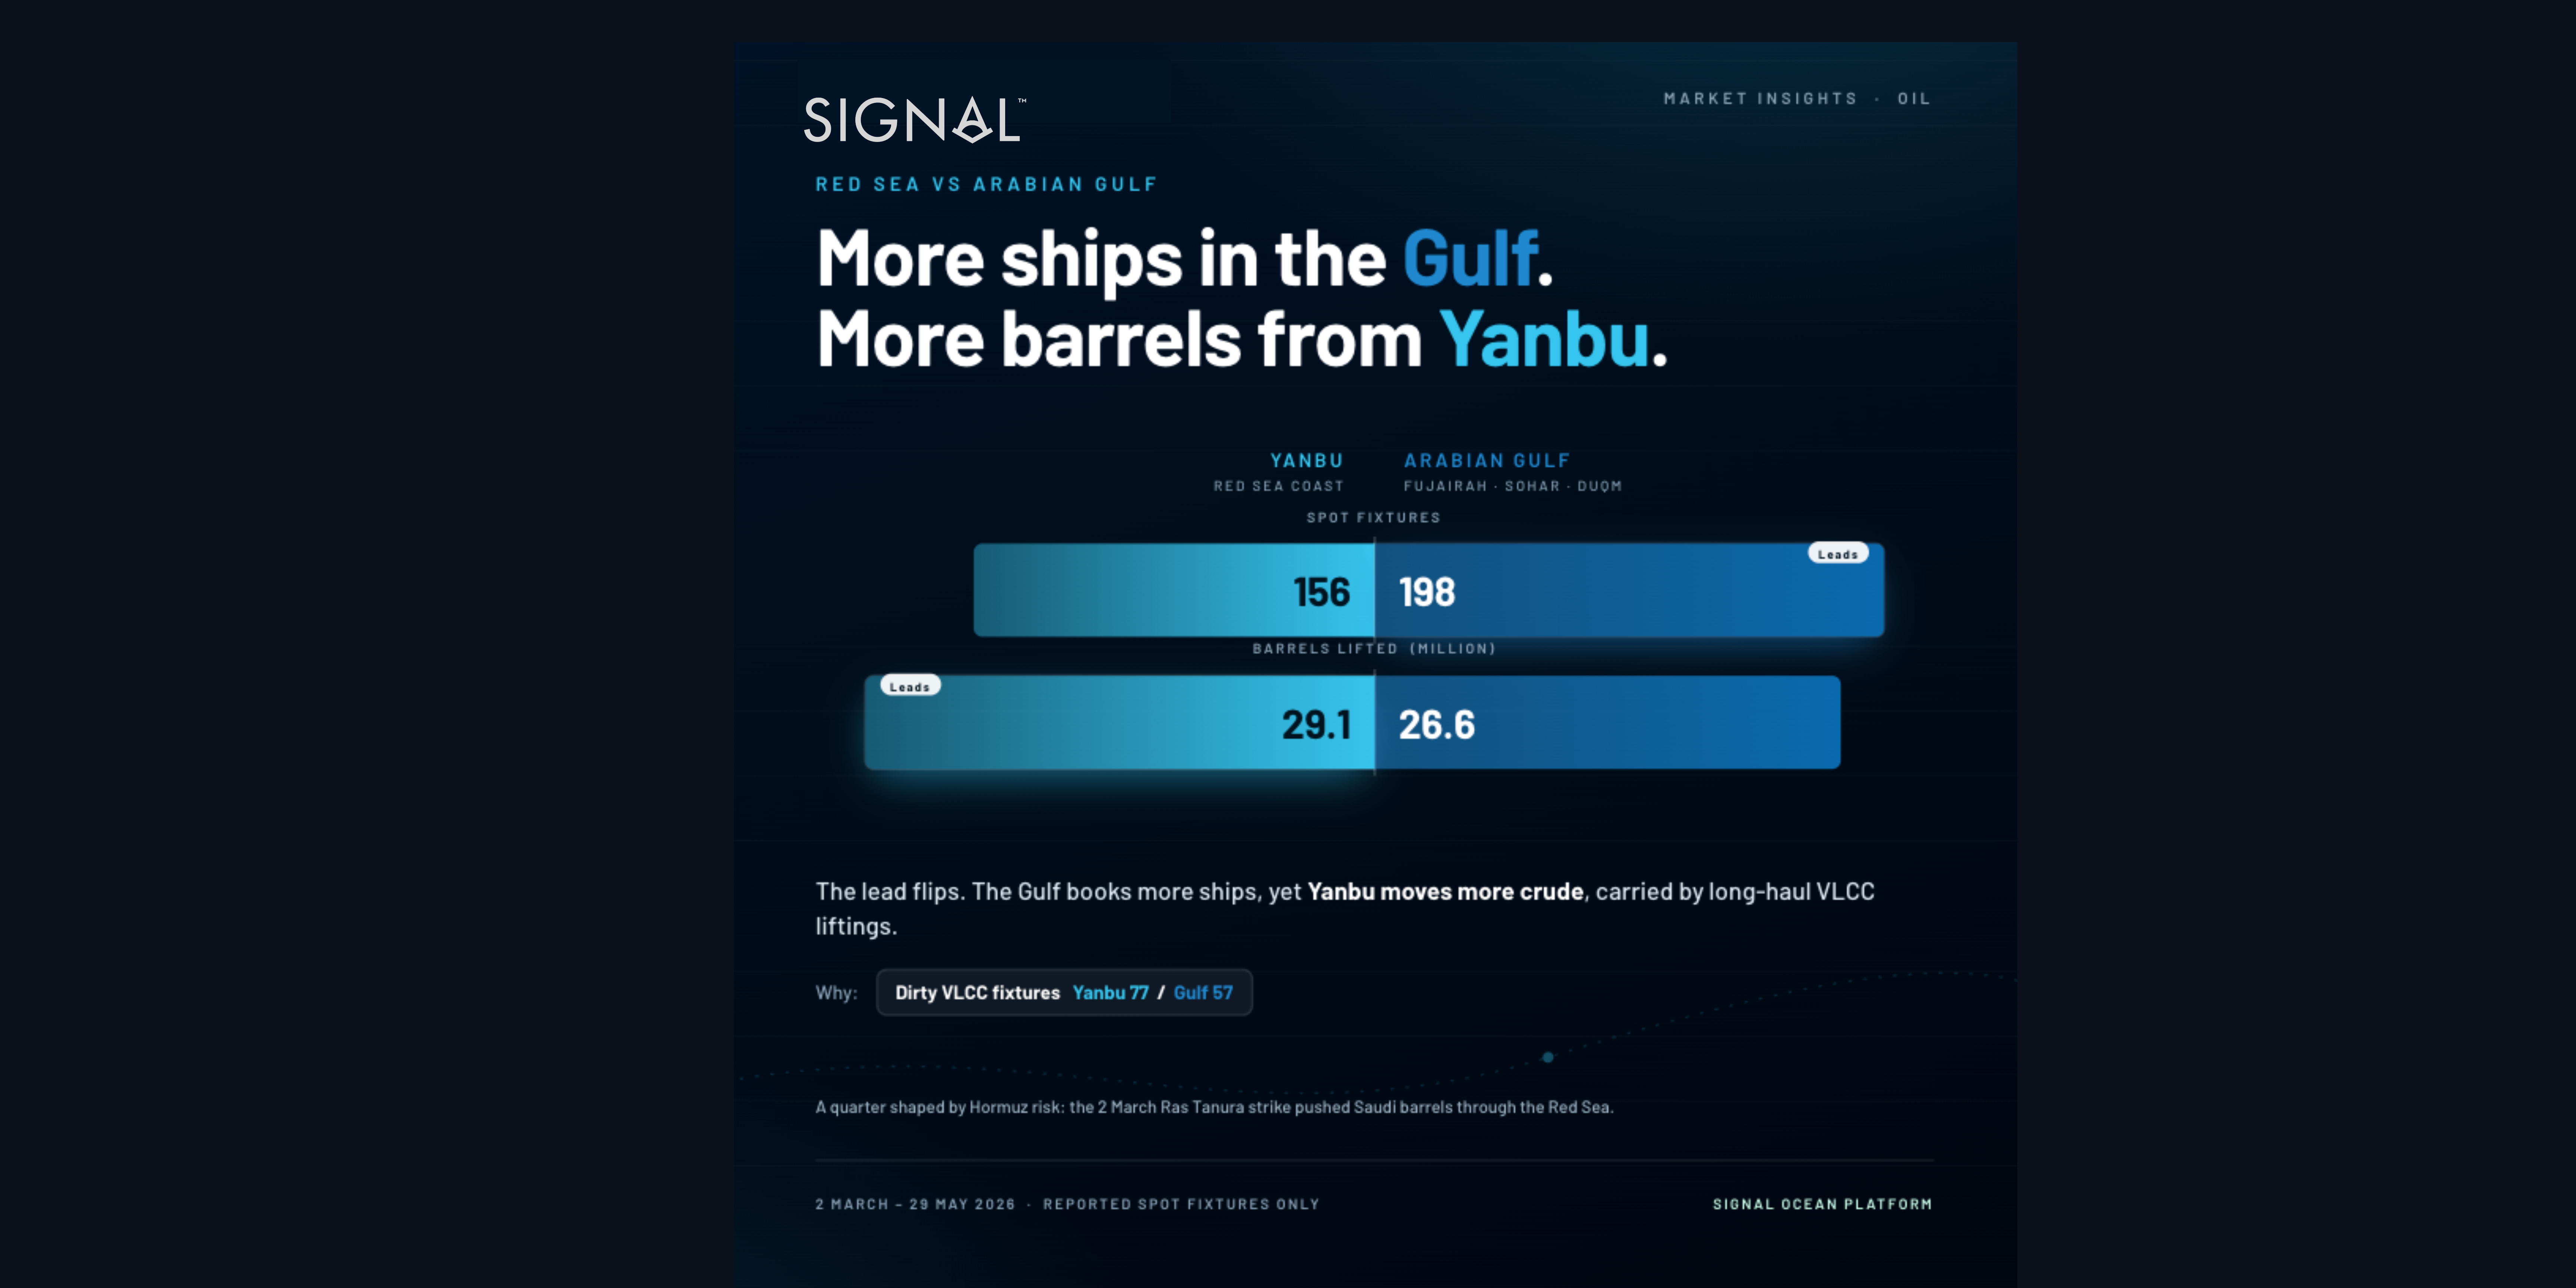
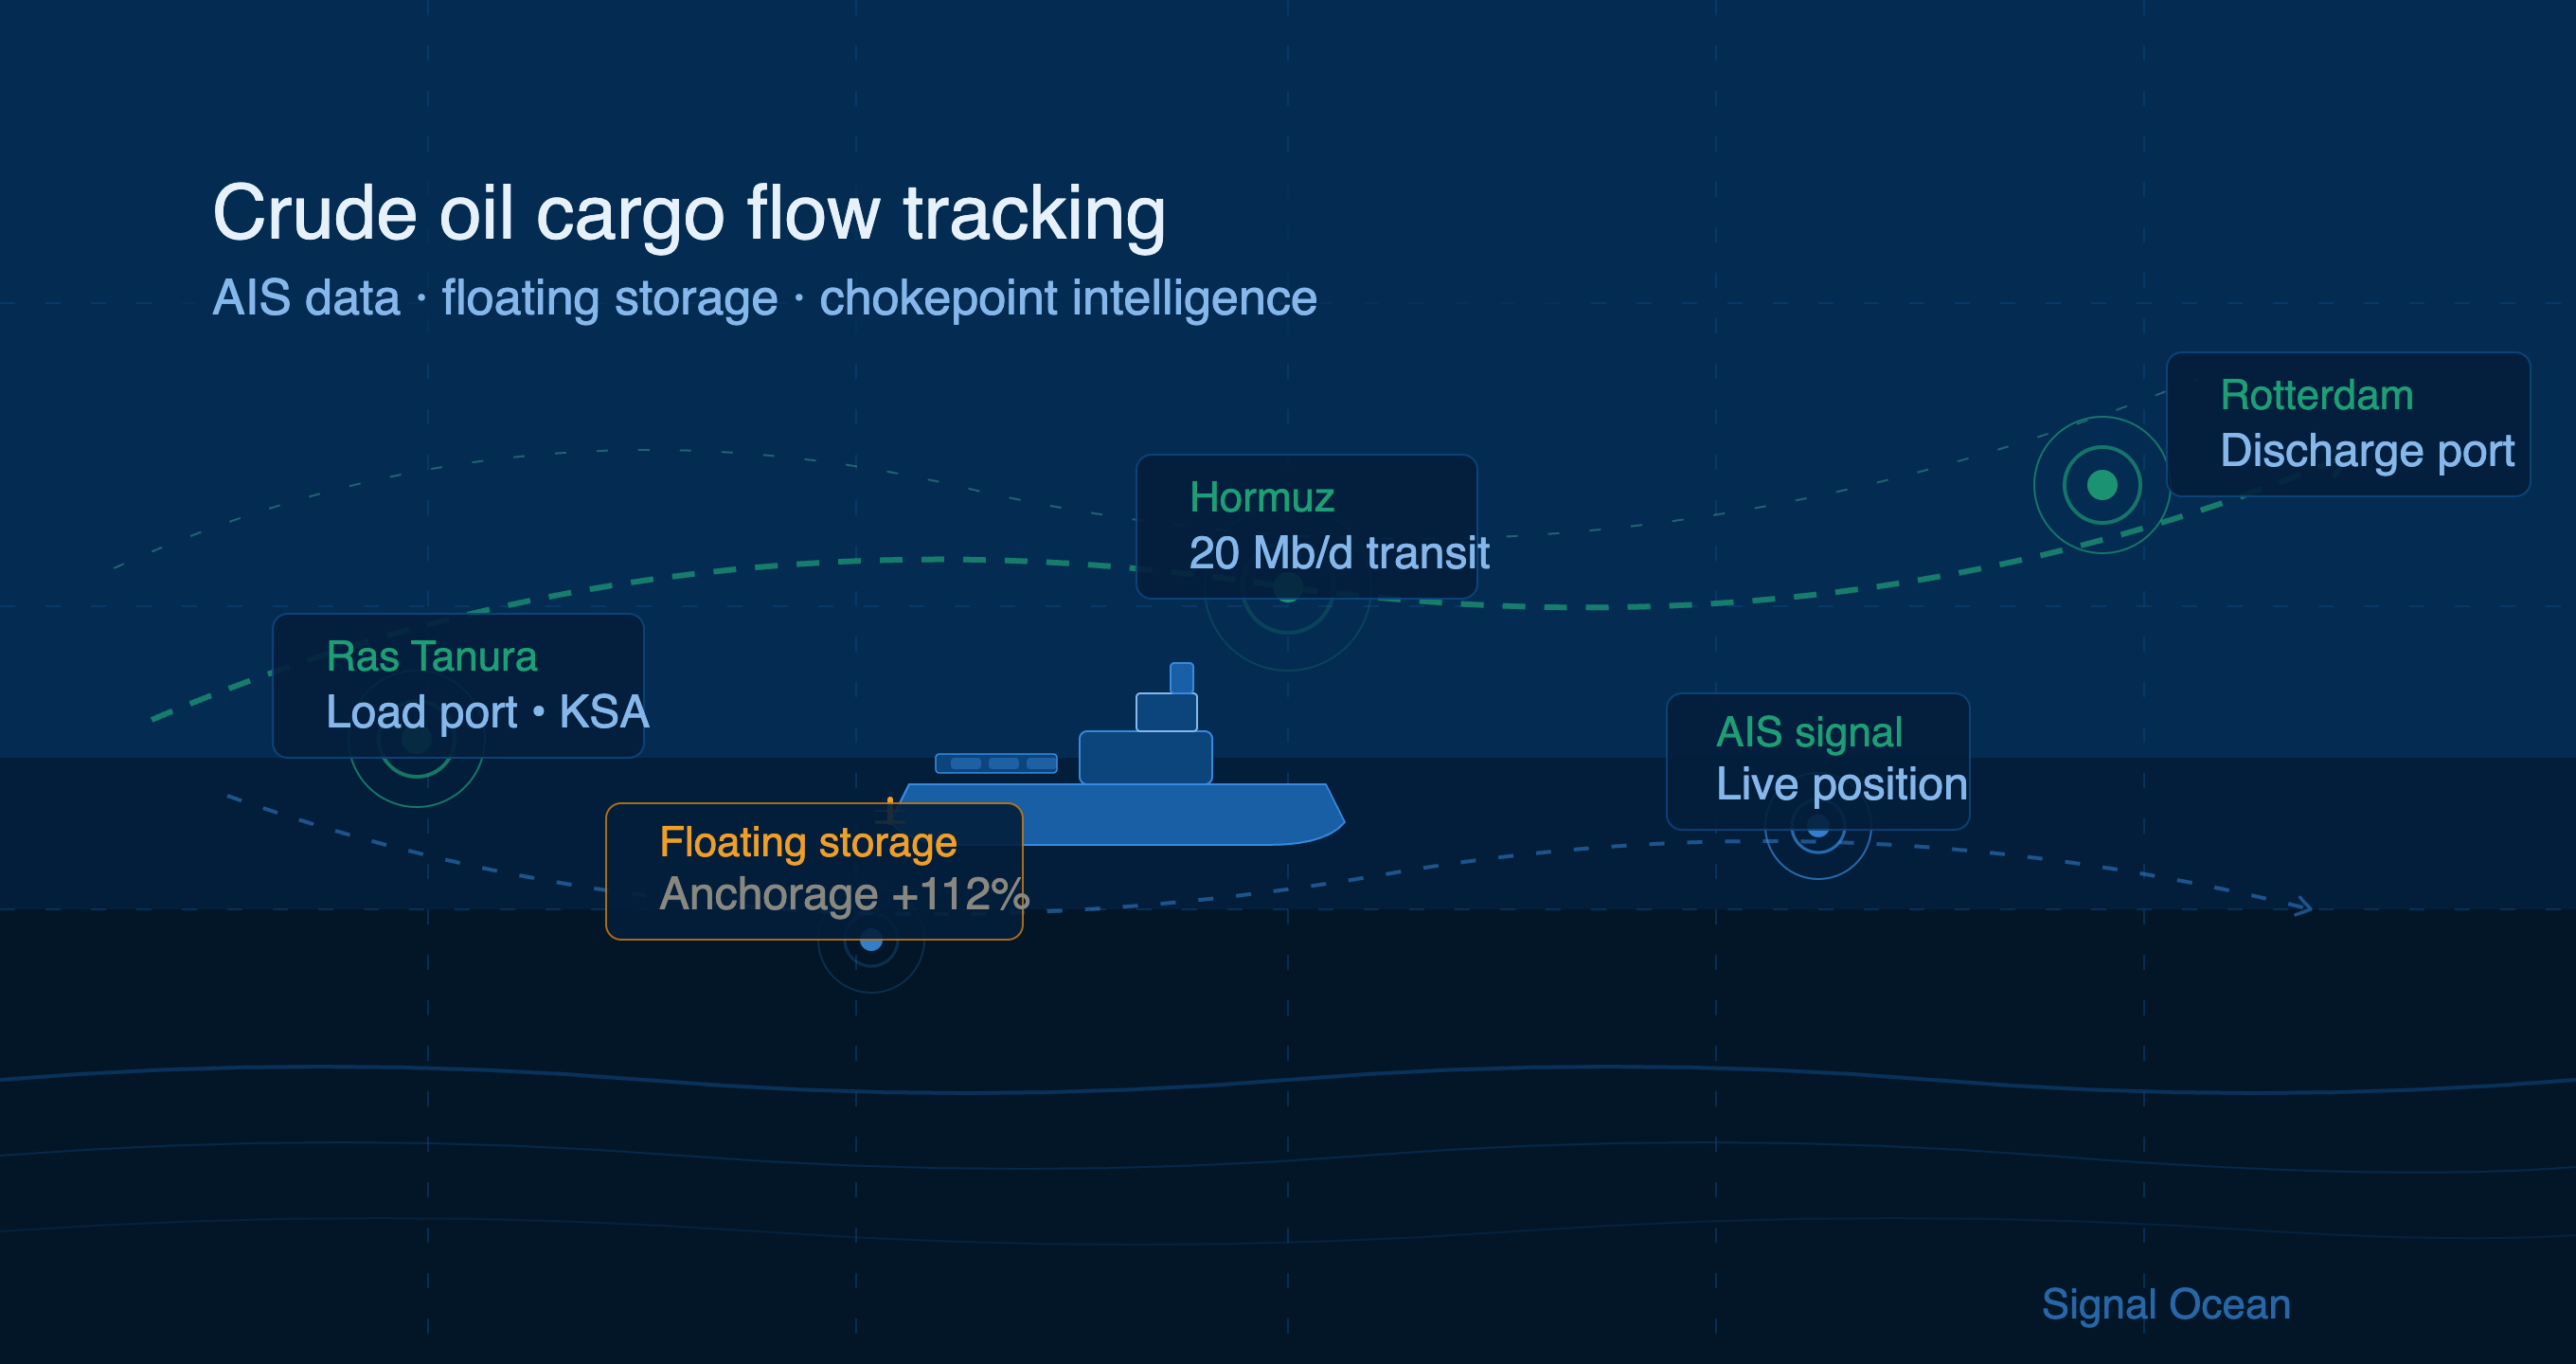
In the dirty tankers segment, TCE rates for VLCCs fluctuated from highs to lows within a few months. This tanker segment had a positive momentum in March as crude exports increased driving VLCC demand and freight rates upwards. Following a dramatic collapse of OPEC+ discussions on March 6th where Russia responded with “Nyet” to oil production cuts, Saudi Arabia announced that it would raise its crude output and offer market discounts. In the Arabian Gulf to Asia route, specifically, TCE for VLCCs reached a record high in mid-March at $243K as the demand for VLCCs was high in Ras Tanura. Also, concerns over an oversupply of oil due to the stalled economy caused by the pandemic forced traders to book tankers as floating storage driving VLCC demand further.
The course was reversed, however, during the second half of the year with available tonnage increasing as vessels were released to the market, reducing freight rates and shipowner earnings. After a high of Worldscale 223 in Q1, rates dropped and have remained below Worldscale 60 from June through November. Freight rates bottomed at $6.1K in September far below breakeven rates if one considers that operating expenses alone typically range between $8-10K.
Let’s now have a look at the overall supply for VLCCs in the Arabian Gulf. Once we start counting available vessels, we notice that for the first half of the year, 70 vessels are available on average on a daily basis, while for the second half, average supply increases to 90 vessels, representing an increase of 28% in VLCC supply.
On the demand side, VLCC fixtures in the Arabian Gulf were strong in January, March and May ranging between 105 and143 fixtures per month but dropped below 90 in the remaining months, with the lowest number of fixtures for the year recorded in August, with 63 fixed VLCCs. Demand has dropped by about 24% for the second half of the year.
Clean Tankers – LR2s

The clean tanker segment, and LR2s specifically, had a disappointing start to the year in the Arabian Gulf. LR2s, however, saw a massive increase in earnings out of the same region in April with TCE skyrocketing to $154k or just north of Worldscale 500. The spike did not last long and rates declined but looking at the demand the number of fixtures remained at steadier levels compared to the crude market.
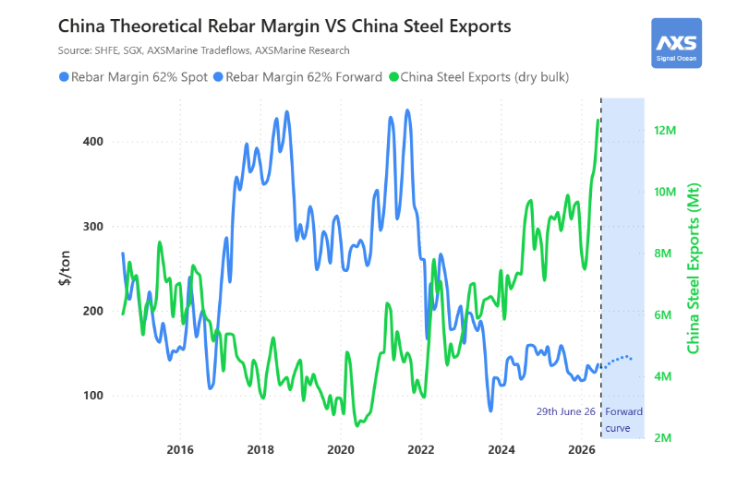
Dry Market – Capesizes

A revival of the Chinese steel industry depleted stocks of iron ore in the region, a key ingredient for steelmaking, and renewed the need for imports from Brazil. After a weak first half for the Capesize segment, Brazil-China freight rates peaked in the beginning of the third quarter, with tonnage supply running low in Santos, as China engaged high ton-mile iron ore imports from Brazil.
China balances out global crude oil market

According to oil data analytics firm OilX, during 2020, China imported a total of 11.01 million bpd, a 8.5% increase compared to last year. While China was the first country that was impacted by the covid-19 outbreak, it seems that it has since bounced back strong. In fact, OilX argues that the world’s largest importer of crude oil is on track to be the only major country to raise its oil demand year-on-year. In 2020, the high demand for crude oil in China was responsible for balancing out the lost demand from other regions providing support for the global crude oil market.

The Chinese imports increase of both crude oil and dry cargo, led to significant port congestion and difficulties in accommodating the high number of VLCCs and Capesize vessels. The average waiting time for vessels that were waiting to discharge outside of Chinese ports ranged from several days to two weeks, leading, as a result, to an increase in Ton Days as illustrated in the graphs below.

Impact on bunker fuel prices

The year started with the IMO 2020 regulation kicking in, one of the most significant changes in the tanker industry in recent years. Beginning January 2020 vessels are required to either utilise low sulfur marine bunker fuel such as VLSFO or use the cheaper bunker fuel alternative, HSFO, only if they are equipped with scrubbers. As a result, VLSFO prices were expected to soar and scrubber fitted vessels to benefit from bunker savings. And then, coronavirus happened.
As the first wave of the pandemic started its ripple effect early in 2020, the industry experienced a substantial fall in bunker prices. Compared to the start of the year, fuel prices dropped during the first five months of the year going from $400/mt to $276/mt for HSFO and from $648/mt to $216/mt for VLSFO. At the beginning of the year, the average spread between VLSFO and HSFO was at $248. At the end of November, the spread between the two fuel types had been reduced to $60.
The drop in marine fuel prices benefited some and damaged others. For some industry players including shipowners and charterers, the drop in VLSFO prices has surely been comforting. For others, however, such as bunker suppliers, the decrease in fuel price increased pressure. The price drop did not additionally favour the shipowners who invested in scrubbers in order to comply with the IMO 2020 regulation as this development will likely delay their return on their investment. Things started moving northwards during the second half of the year, where bunker fuel prices saw an uptick through the end of November but have remained low compared to the start of the year.
Treading in uncharted waters
As there is some glimpse of hope that stems from the news of an effective coronavirus vaccine, the shipping industry is looking for a global recovery that will undoubtedly take some time before the industry reaches pre-pandemic levels. At the time that this article is written, all key agencies, IEA, EIA and OPEC, have lowered their oil demand forecasts for 2021 presenting a somewhat improved yet still gloomy outlook in months ahead. As the world adjusts to this new normalcy and countries gradually open up economies, we expect calmer seas and that the long voyage to recovery will eventually begin with the product tankers segment. Commercial shipping is an industry acclimatised to volatility and with shipping analytics tools such as The Signal Ocean Platform, shipowners, brokers and charterers can tread confidently in uncharted waters by feeding their models with maritime data to assess market conditions in real-time and make their own data-driven commercial decisions.


Ready to get started and outrun your competition?


.png)


.png)


.png)

.png)

.png)


.png)


.avif)


.avif)


