drives these stories

This year has been a challenging one for tanker freight rates, while the dry bulk and container markets have been experiencing decade highs with elevated rates not seen before in maritime. What is more, there should be persistent concern regarding the drivers behind this adverse evolution from the summer of 2020 till today. In this piece, we will examine the degree to which the plunge in the tanker freight market is driven by the oversupply of ships, and by the remarkable volatility in the recent estimates on world oil supply and demand that has had an enormous impact on the healthy rebalancing of the shipping market, prolonging the downturn cycle we see months now.
The IEA and OPEC recently underlined that the economic impact of the Covid-19 Delta variant and rebounding output mean that expectations of global oil demand outstripping supply are fading. In its closely watched monthly market report, the International Energy Agency said that the worsening of the pandemic, as well as revisions to historical data, mean its global oil demand outlook has been “appreciably downgraded,” with some of this year’s forecast recovery shifted to 2022.
The IEA cut its 2021 global oil demand growth forecast by 100,000 barrels a day, while upgrading its 2022 forecast by 200,000 barrels a day. Both the IEA and OPEC expect the world’s thirst for oil to return to pre-pandemic highs in the second half of next year. The Paris-based organization commented that the timing of the variant’s spread has coincided with planned supply increases from the Organization of the Petroleum Exporting Countries and its allies “stamping out lingering suggestions of a near-term supply crunch or supercycle.”
The latest OPEC Monthly Oil Market Report projected world oil demand to increase by 3.3mb/d year-on-year in 2022 and to surpass 100mb/d in the second half of 2022. Economic growth is estimated to pick up on the back of massive stimulus packages, whereas the Covid-19 pandemic is anticipated to be under control, supported by vaccination programmes and improved treatment, allowing for steadily rising oil demand in both the OECD and non-OECD. For the non-OECD, oil demand is expected to grow by 1.8 mb/d, led by China, other Asian countries and India. Demand in China and India is likely to outstrip pre-Covid-19 levels, due to a healthy rise in demand for transportation and industrial fuels. Additionally, mobility increases and progress in the industrial sector will fuel oil demand growth for other Asian countries, Latin America and the Middle East.
Prospects on product markets and refinery operations emerged promising in July driven by an increase in refinery margins for July, which was supported by the seasonal strength of transport fuel. In the U.S, OPEC Monthly Oil Market Report highlighted that a counter seasonal decline in refinery utilization rates and the subsequent downward pressure on product inventories, as well as strong exports to South America, lifted product markets in the country. It added that there is also a positive sentiment in Asia due to a healthy regional fuel consumption, robust petrochemical feedstock demand and strong conversion margins that lead to gains for clean products.
In July, IEA mentioned that world oil markets are on edge with OPEC+ negotiations to boost supply now in deadlock. Most OPEC+ delegates tentatively agreed to raise output by around 400 kb/d per month from August until the remaining 5.8 mb/d supply cuts are unwound, effectively extending the deal to the end of 2022. Overall, oil markets are likely to remain volatile until there is a clarity on OPEC+ production policy, while the uncertainty over the potential global impact of the Covid-19 Delta variant in the coming months is also tempering the sentiment.
Using Signal Ocean data, we will review how tanker freight markets have been responding to these highly volatile and fundamentally oversupplied market conditions, by examining the evolution of supply-demand balance, cargo volumes, ship supply, average laden speeds, idle times for major dirty and clean trading routes and from pre Covid-19 times until today.
Freight Market
Drop in demand for seaborne crude oil combined with a steady flow of vessels returning from floating storage and strict oil production cuts in countries exporting crude oil caused crude tanker freight rates to record a sharper decline than the smaller vessel segments. Few carry market expectations for a strong second and third quarter of this year, however, there is a bullish sentiment for recovery of freight rates in 2022 and 2023, also backed by positive signs in the correlated oil market macroeconomics. A gradual soft upward sentiment of freight rates towards the end of this year may still be a possibility.
In image 1, we plotted the performance of tanker freight rates on major clean and dirty trading routes per ship size from the fourth quarter of 2019 till summer of this year. We see the spikes of freight rates at the end of 2019, pre-Covid, and first quarter of 2020, whereas the volatility has pretty much flatlined ever since.

In the crude tanker routes, VLCC- AG to Far East, the decline comes to 78% of WS rate at the end of July this year compared to the average value of October 2019 and a similar reduction of about 70% was encountered in the Suezmax- Wafr to Cont. In the Med Aframax and the Caribs-USG Panamax segments we have seen 50% fall in the average value of July compared to October 2019, whereas, in MR1/MR2 clean routes, the decline is around 20-24% decline. The graph also depicts a recent and gradual upward trend on MR2 routes, which could become even stronger during autumn, given the optimism on the prospects of product markets and refinery operations that OPEC outlined in their latest Monthly Oil Market Report.
Cargo Volumes
Looking at the volume of cargoes to help us interpret the current trends across routes and sizes, we can see the intense volatility with mostly downward momentum from the third quarter of last year till the end of the second quarter of this year. However, July ended with signs of recovery in the AG for VLCC and Panamax tankers. In image 2, we plotted the evolution of cargo volumes in key loading areas for VLCC, Suezmax, Aframax and Panamax tankers. In the Suezmax segment, the anemic volume of cargo intensity at West Africa is a clear signal for sharp fall in Suezmax WS rates.
%2520-%2520Signal%2520ocean%2520platform.avif)
In MR2 and MR1 segments, images 3 and 4 show how the Caribbean region provides a much stronger outlook from May till July, while the West African market despite a strong spike in May shows soft sentiment along with other areas. In the MR2 segment, AG region appears promising with a continued upward volume over the last three months.
%2520-%2520Signal%2520ocean%2520platform.avif)
%2520-%2520Signal%2520ocean%2520platform.avif)
By examining all the above, overall, the cargo intensity provides a stronger image in the clean segment compared to crude, however, the AG region gives strong prospects for VLCC and MR2 sizes.
Supply Trend
The supply trend graph below (Image 5) depicts the evolution of the number of ships available to load at major areas over time. The graph pretty much explains the current freight market sentiment and provides insight into the downward cycle of rates. The gloomiest picture appears to be in the VLCC segment with AG Ras Tanura supply trend presenting a 54% increase compared to the levels of September 2019, while Suezmaxes out of West Africa come in at a 46% increase. In contrast with the picture of the larger crude carriers, the Aframax Med supply trend, despite the spikes we experienced between the end of the second quarter and third quarter of last year, is now fluctuating at almost similar levels to September 2019.
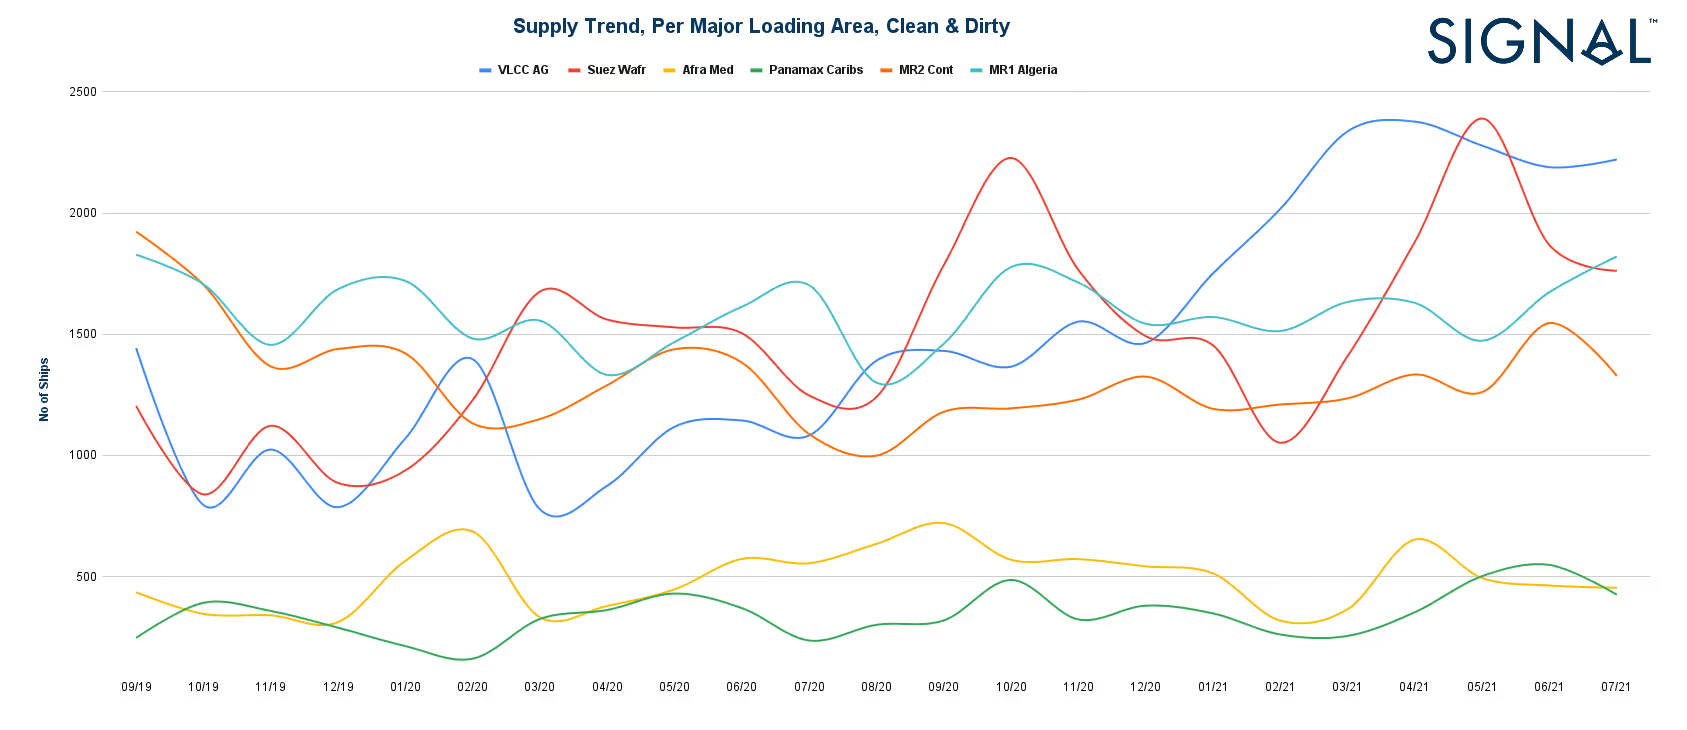
- VLCC AG-Ras Tanura: based on 16 days laycan, fwd, pushed/pushed poss and spot relet vessels
- Suez Wafr Escravos: based on 20 days laycan, fwd, pushed/pushed poss and spot relet vessels
- Afra Med Ceyhan: based on 6 days laycan, fwd, pushed/pushed poss and spot relet vessels
- Panamax Caribs Mamonal: based on 12 days laycan, fwd, pushed/pushed poss and spot relet vessels
- MR2 Cont Houston: based on 12 days laycan, fwd, pushed/pushed poss and spot relet vessels
- MR1 Algeria: based on 12 days laycan, fwd, pushed/pushed poss and spot relet vessels
In the clean segment, the supply trend in Algeria for MR1 vessels has been more or less consistent pre and post Covid, with similar levels of supply in July 2021 and September 2019. The most promising outlook is presented in the MR1 segment, as the Continent supply trend recorded a declining trend with the volume of available ships falling by 31% in July compared to September 2019 levels.
Idle Time per Voyage
The significant overall increase in the supply of dirty tankers as a reflection of the tough conditions of voyage optimization and profitability in employment opportunities led the idle time per voyage to a sharp increase from the end of the fourth quarter of 2019 and the first two quarters of this year.

In image 6, we plotted the average value of idle time per voyage for crude and clean tankers, per ship size to compare the fleet utilization across ship sizes and foresee positive market prospects for freight earnings. The results for MR1 and MR2 clean segments present a declining trend in the average idle number of days compared to excessive highs of VLCCs. However, in the crude tanker segment, the Suezmax and Aframax dirty tankers recorded a fall at the end of the second quarter of this year, which may bring a stronger third quarter outlook in freight earnings for the smaller crude tanker ship sizes.
Laden Speed
The challenges of the continued downturn of the tanker freight industry directed ships towards lower speeds to reduce fuel consumption as tanker earnings are still facing mounting pressure. In image 6, we plotted the fluctuations in laden speed applied over the last 12 months, where the estimates confirm a declining trend across all sizes over the last three months with an exemption in the MR1 segment.

Slow steaming seems to be an obvious counter-balancing remedy for the crude tanker segments, as crude oil supply and demand estimates are still trying to find a healthy pace to support vessel earnings. Indicatively, the laden speed of VLCC tanker fell to 11.67 knots end July compared to 12 knots end September 2020. This persistent declining trend of laden speed in crude tanker ships can lead the average laden speed of seagoing vessels to fluctuate at levels of lower than 11knots, however, in the MR clean segment, the trend seems to be on the rise again towards 12knots.
Outlook
The tanker market is expected to undergo severe challenges on oil demand that may prolong the downturn of freight rates during the second half of this year mainly for the crude segment. Significant risks to the demand outlook remain, with the spread of the Covid-19 ‘Delta’ variant raising concerns about the pace of oil demand recovery in Europe, North America and Asia. Looking ahead, supply and demand freight market dynamics will see improvements in 2022 due to continued rebound in global oil demand and scheduled easing of supply cuts that will support crude and product tanker shipments and freight rates’ upturn. Market consensus is that 2022 will be the year of freight rates’ increase above 2019 levels and rebalance of oil supply with world demand.
This tanker shipping market report for dirty and clean products was produced using insights, data and reports from the Signal Ocean platform.
To generate the same insights for your business and learn more about The Signal Ocean platform, request your demo.
-Republishing is allowed with active link to source


Ready to get started and outrun your competition?


.png)


.png)


.png)

.png)

.png)


.png)


.avif)


.avif)