Signal Ocean Platform: Vessel & Fleet Emissions Monitoring
On this page:
To address decarbonization initiatives and greenhouse gas emissions monitoring, Signal Ocean has built a suite of analytics within the Signal Ocean Platform — delivering detailed statistical measures for vessel pollution, carbon intensity efficiency, and alignment with industry standards' targets.

The Signal Ocean Platform allows users to compare a vessel's or fleet's performance against the IMO's Carbon Intensity Indicator, Poseidon Principles and Sea Cargo Charter targets. The Platform covers all tankers above 25Kt, dry cargo, and LPG vessels. We will extend the platform's coverage to include smaller wet later this year, with Container and LNG ships estimates added after that. Signal Ocean will continue to invest in this area and respond to new measures as the IMO introduces them.
Using the Signal Ocean Platform technology to estimate tonnage for a cargo, our customers can consider the CO2 impact when chartering ships alongside their Time Charter Equivalent (TCE) rates. Key influencing factors include not only the emissions during the laden sea passage of a voyage but also ballasting, route deviations and other operations, all in conjunction with technical ship characteristics, age, shipyard/design, use of scrubbers and type of fuel used.

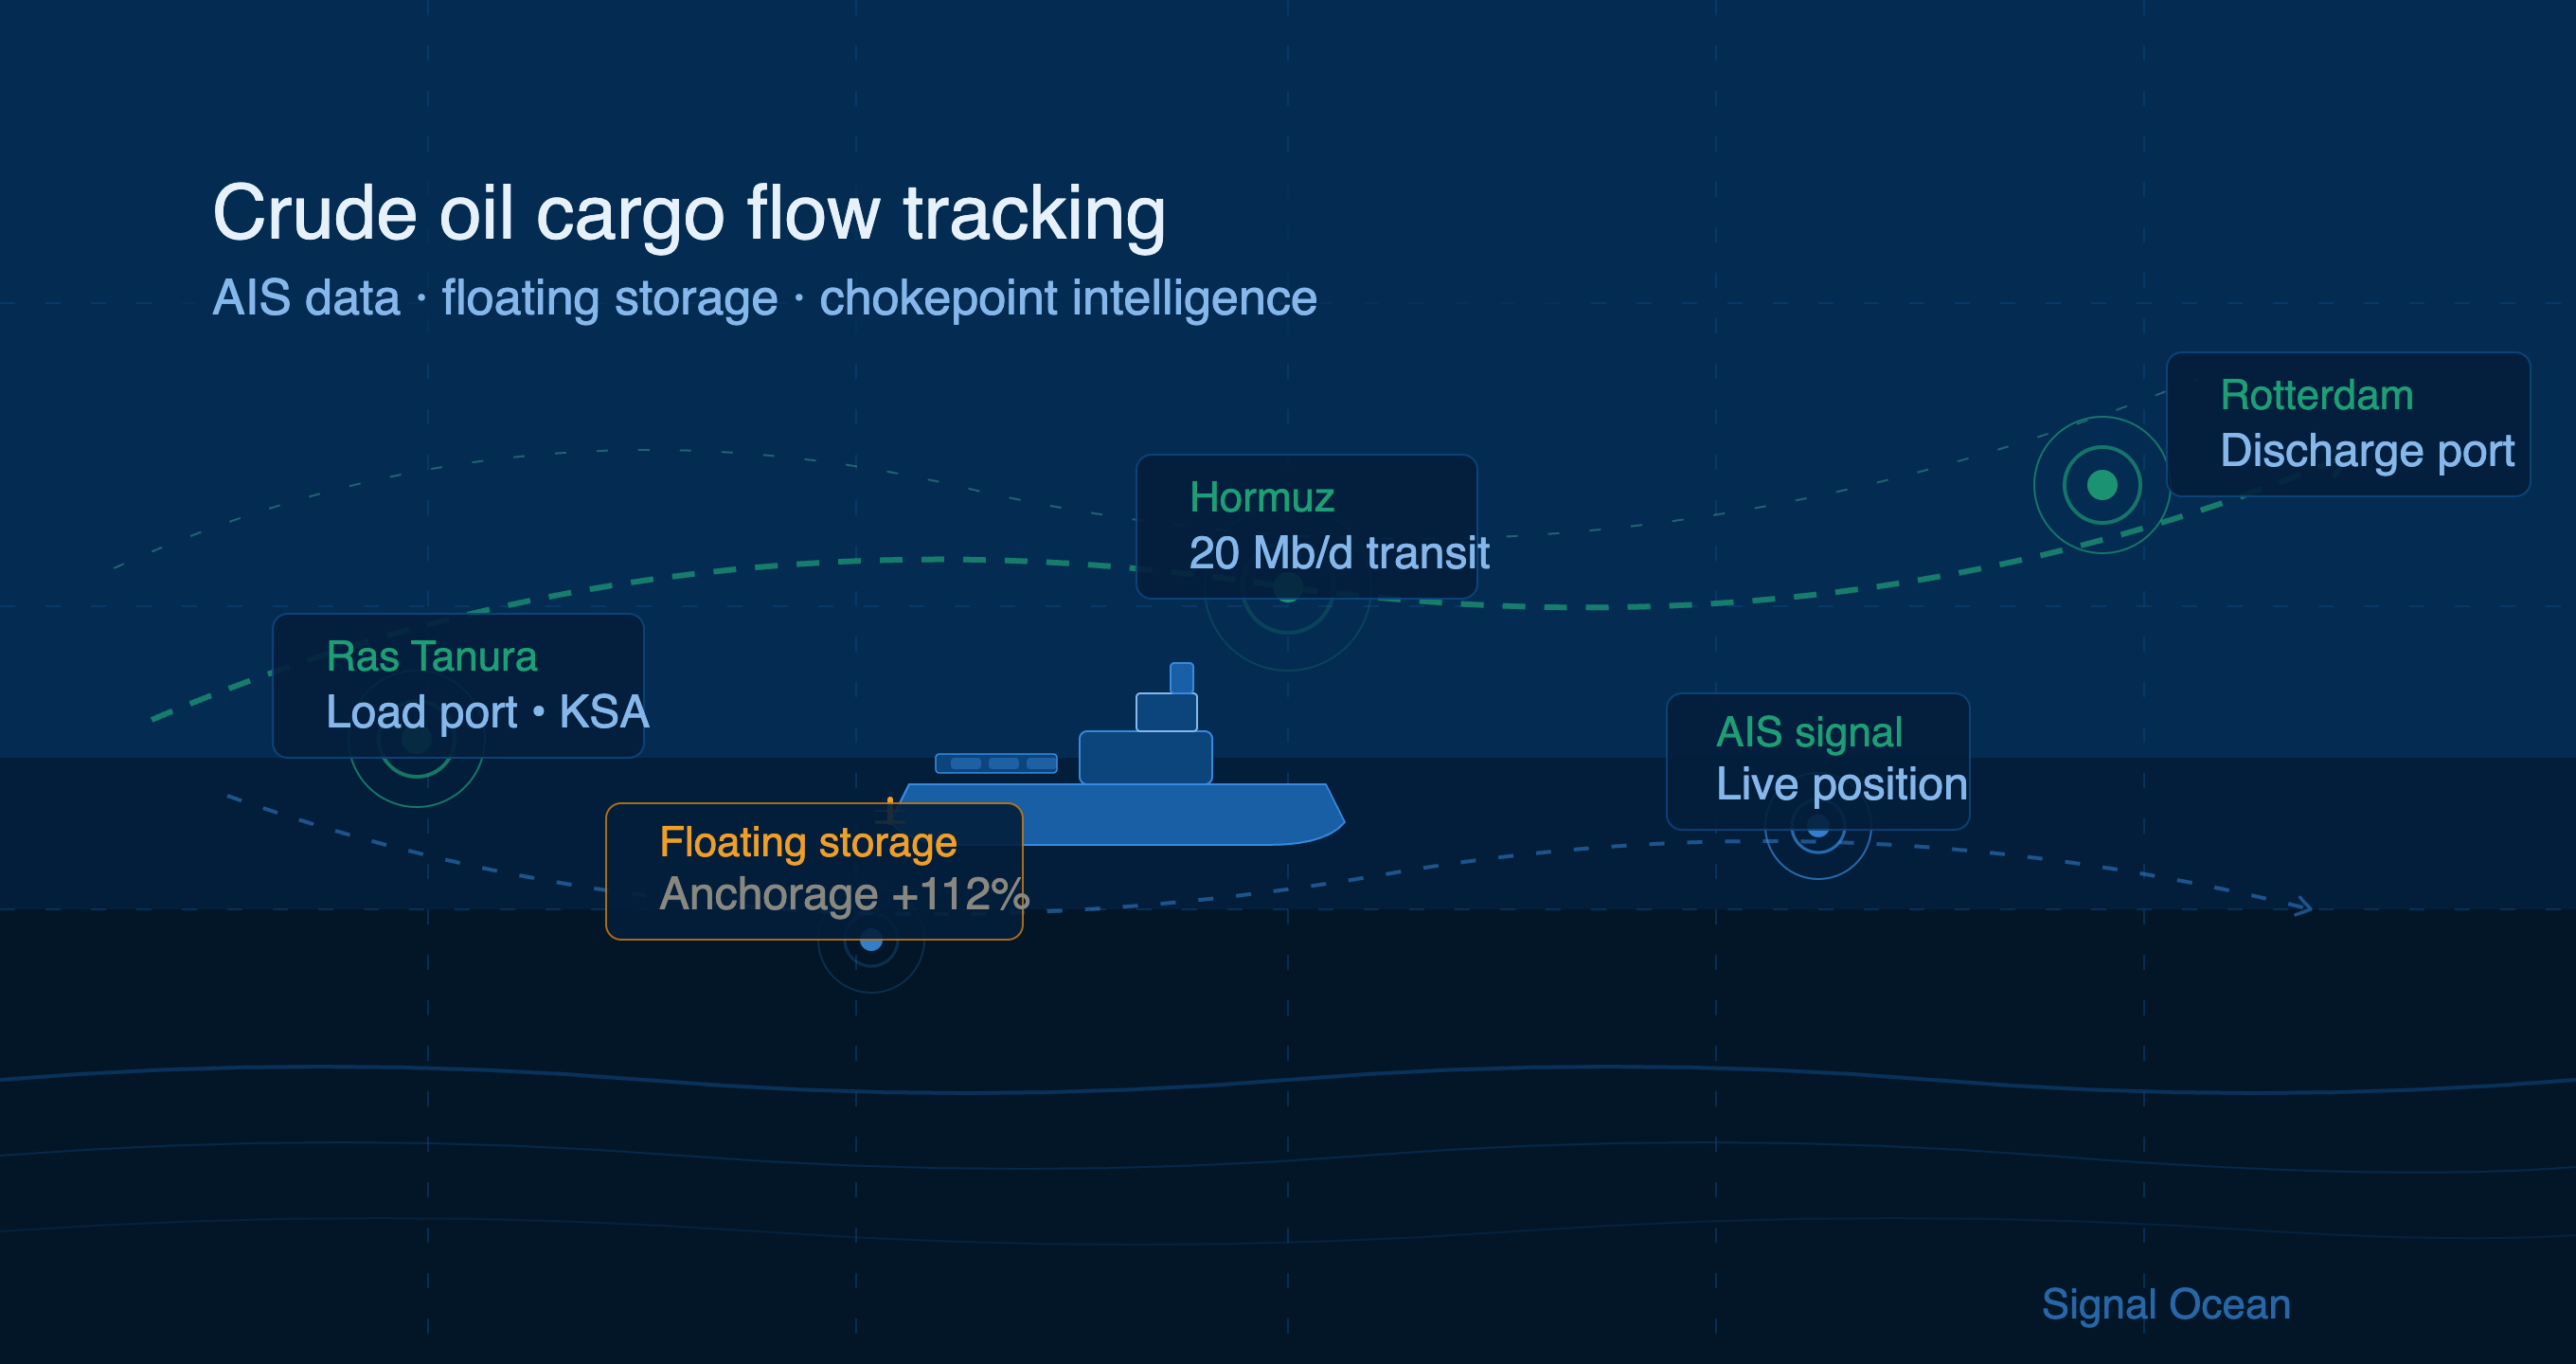
The Signal Ocean Platform estimates vessel emissions, such as CO2, using Signal’s rich voyage structure, AIS data enhanced with a rich proprietary geospatial database. The enhanced AIS data allows the Platform to map a given vessel's movements down to the jetty level.
Overall voyage is converted into a single stream of commercial activity where all stops for bunkering operations, idle times, repairs, loads and discharge operations have been taken into account. Ballast and laden legs and SECA navigation times are clearly defined at sea. Models estimating consumptions for each operation include vessel particulars, country built, year built, scrubber fitting, operational conditions and vessel speeds. Fuel consumption is mapped to different types (e.g., VLSFO, MGO, HSFO) based on the area that vessels have been trading, the information about whether a ship is scrubber fitted, and emissions are derived from consumptions using IMO references.
Vessels operate very differently based on size, which is highly influenced by market levels. They journey in different geographical areas, in different periods, under different speeds, with different designs, consuming different fuels and having different trading strategies. Thus, the algorithm focuses on presenting and breaking down the output emission data in the most detailed manner possible, producing all the essential information that any analyst might need.
Signal emissions models validation
DNV has issued a formal Letter of Professional Opinion that recognizes the validity and robust nature of Signal Ocean's emissions estimates.
Following a detailed review, Dr George Dimopoulos, Principal Specialist and Head of DNV Maritime's R&D and Advisory Unit, said:
"After the review, our qualified professional opinion is that the subject Vessel Emissions Algorithm of Signal Ocean meets the required standards detailed in MARPOL's carbon intensity calculation guidelines. DNV invests substantially in research, development, and innovation to provide value to our customers and society. We will continue to actively support initiatives and developments that advance digital smart solutions to tackle decarbonization of the maritime industry."
Read the full DNV press release →
Frequently Asked Questions
What emissions standards does Signal Ocean's platform track? The Signal Ocean Platform tracks performance against the IMO's Carbon Intensity Indicator (CII), the Poseidon Principles, and the Sea Cargo Charter. As the IMO introduces new measures, Signal Ocean updates the platform accordingly.
Which vessel types are covered? The platform currently covers all tankers above 25Kt, dry bulk, and LPG vessels. Coverage will expand to include smaller wet tonnage, containers, and LNG ships in subsequent releases.
How does Signal Ocean estimate vessel emissions? Emissions are estimated using AIS data enriched with a proprietary geospatial database, mapping vessel movements down to the jetty level. The model accounts for ballast and laden legs, SECA navigation, bunkering stops, scrubber fitting, and fuel type (VLSFO, MGO, HSFO) to derive CO2 output against IMO references.
Has Signal Ocean's emissions methodology been independently validated? Yes. DNV issued a formal Letter of Professional Opinion confirming that Signal Ocean's Vessel Emissions Algorithm meets the standards set out in MARPOL's carbon intensity calculation guidelines.
Can charterers use Signal Ocean to assess CO2 impact at the point of fixture? Yes. The platform allows users to factor CO2 emissions into chartering decisions alongside Time Charter Equivalent (TCE) rates, accounting for laden and ballast legs, route deviations, and vessel-specific technical characteristics.
Summary
The maritime community faces an unprecedented challenge in complying with the IMO's targets for decarbonization, but industry stakeholders are working hard to improve emissions performance.
Robust, consistent, data-driven estimates for vessel emissions performance are the crucial next step in providing greater transparency and allowing market participants to make informed decisions.
Request a Demo with Signal Ocean
See how the Signal Ocean Platform can support your fleet's emissions strategy — from CII compliance to fixture-level CO2 analysis. Request a Demo →
Increased Use of Renewable Energy:
Shipping companies are embracing renewable energy sources to power onboard systems and reduce emissions during port operations. Solar panels and wind turbines are being installed on vessels to generate clean energy, reducing reliance on auxiliary engines, and cutting down emissions. Shore power facilities in ports allow ships to connect to the electrical grid, eliminating the need for onboard generators while docked.
Collaboration and Industry Partnerships:
Recognizing that addressing emissions requires collective action, shipping companies, governments, and organizations have formed partnerships and collaborations. These initiatives focus on research and development, sharing best practices, and promoting knowledge transfer. Joint projects aim to develop and deploy innovative technologies, improve infrastructure, and create a supportive regulatory framework to accelerate the industry's transition towards a greener future. The Zero Emission Shipping - Mission Innovation.
To pave the way for a greener future in shipping, the availability of alternative fuels plays a vital role in their widespread adoption. However, this availability is influenced by factors such as port infrastructure, local regulations, and government policies. As the demand for cleaner fuels in shipping rises and environmental regulations become more stringent, efforts are underway to improve the accessibility of these fuels through infrastructure development, collaborations, and investments in production facilities.
Liquefied Natural Gas (LNG) infrastructure has seen significant growth in recent years, resulting in more LNG bunkering facilities and LNG-powered vessels. Nonetheless, the availability of LNG as a marine fuel can still vary depending on the region. To ensure consistent availability worldwide, there is a need for further development of LNG supply chains and infrastructure. For biofuels, their availability hinges on production capacity and the availability of feedstock. Although biofuels are being produced and utilized in various sectors, their availability as a marine fuel remains limited. Scaling up biofuel production and establishing robust supply chains are imperative to ensure wider availability within the shipping industry.Hydrogen, as a fuel for maritime applications, is still in the early stages of infrastructure development. While some hydrogen vessels have been tested or introduced in the first quarter of last year, the infrastructure required for hydrogen production and distribution needs further advancement.
Ammonia, as a marine fuel, currently faces limitations in availability. The production, storage, and handling infrastructure for ammonia need further development to support its widespread use in the shipping industry.Methanol, on the other hand, is already a commercially available fuel and has been used as a blend with conventional fuels in some ships. However, its availability as a standalone marine fuel can still be limited in certain regions. Bureau Veritas in October 2022 published a White Paper for the Alternative Fuels Outlook. This white paper provides a comprehensive overview of alternative fuels for the shipping industry, taking into account key factors such as technological maturity, availability, safety, emissions, and regulations.


.png)


.png)


.png)

.png)

.png)


.png)


.avif)


.avif)


