


drives these stories

Signal Maritime Clean Tanker Review: LR2 Market Outlook & Clean Oil Flows
*Signal Maritime examines the impact of clean commodity flows and the new trends coming to freight using data from Signal Ocean*
The end of the first quarter of this year brings strength potential for the clean LR2 segment, as the volume of clean flows from east to west has already increased. It appears that the European ban on Russian oil productsimposed in February opens the doors for firmness in trade from the Arabian Gulf to the West, supporting the increase in demand in ton-miles, with the pace of ocean shipping peaking in early May as the volume of clean oil flows from the East to Europe increases.
In the crude segment, oil shipments from Russia destined for China and India slowed in April after peaks in the first quarter of this year, and it remains to be seen whether Asian energy demand will continue to feed the Russian oil economy. In the clean segment, AG appears to be playing a critical role in the West, with the size of LR2 tankers benefiting from the current trend in oil shipments to Europe.
This Signal Maritime analysis, powered by Signal Ocean, covers recent developments in market prices, direction of flows, cargo trends, ton-mile demand, supply trends, and ballast speed in knots.
In This Article
- I. Market Rates – LR2 AG
- II. Clean Oil Flows from East to West
- III. Vessel Supply Market Trends
- IV. Clean Demand Ton Miles
- Frequently Asked Questions
I. Market Rates - LR2 AG
The beginning of the year was disappointing for LR2 tankers, as rates slumped before and after the ban went into effect, but in March and April, rate trends were more optimistic and sentiment was better. Although recent momentum has yet to reach the peak of over 300 WS (image 1) seen late in the fourth quarter of last year, stable sentiment of around 150 WS has been seen recently. Today's supply and demand fundamentals, as well as the volume of clean oil flows, underscore that a collapse similar to the February lows is not likely to occur soon.
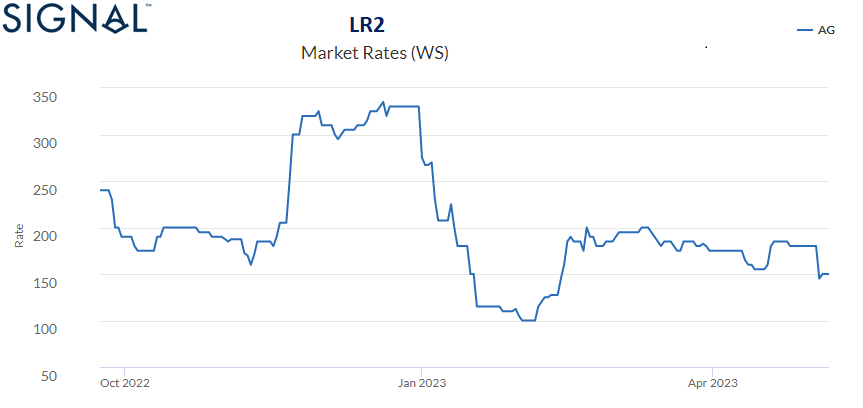 Image 1:Market Prices - LR2 AG, Signal Assessments
II. Clean Oil Flows from East to West
Main Origin Countries
At the beginning of the year, the momentum of clean oil flows from the East to the West weakened, although daily volumes were significantly higher than two years earlier, when the energy industry was not threatened by geopolitical tensions and uncertain Russian oil supplies. As shown in image 2, more clean energy supplies were delivered to the East starting in March, with Saudi Arabia playing a leading role in deliveries to the West. The 25-day moving average is still at a higher level than two years ago, with a downward trend in the last few days, while a peak similar to June/July 2022 could be reached at the end of the second quarter.
 Image 2: Clean Oil Flows - East to West
Looking at flows of clean petroleum products by origin, expressed in monthly volumes (tonnes) (image 3), we see that Saudi Arabia's share has steadily increased over the past year, approaching a share of over 35% of volumes destined for the West. The second most important source country for the Western countries seems to be the region of India with a share of almost 25%, while other Eastern countries with still significant shares are expected in the region of Pakistan/West Coast of India.
 Image 3: Clean Oil Flows - East to West, by Origin Country
Main Destination Countries
The destinations of clean flows to the West are primarily to the Continent, with the Netherlands accounting for 40% of shipments, followed by France at 35% and Belgium at 24%. This trend of high demand from the continent increased significantly in March and April of this year following the announcement of the EU ban on imports of Russian petroleum products and the price cap. We expect the European energy needs to drive a steady increase in demand for tonne-miles for LR2 tankers from AG, which will support firmer freight rate dynamics in the second half of the year.
 Image 4:Clean Oil Flows - East to West, by Destination Country
Vessel Class Breakdown
Today's volume of clean oil flows from the East destined for Western countries is having a positive impact on LR2 tanker size. As shown in image 5, we have seen months of consecutive increases in the monthly volume of tonnes from the ending of the first quarter 2022, with the LR2 tanker size grasping the lion share of business this year. March ended with a peak not seen before in the volume of clean flows from the East to West with a total nearing 5m tonnes, with MR tankers losing share of the business. In the months of January till April 2023, (image 5 right chart), LR2 tankers share is almost 60% compared to 20% share in the case of Panamax size, and 11% share for MR2.
Today's volume of clean oil from the East destined for Western countries has a positive impact on the size of LR2 tankers. As image 5 shows, monthly volumes have steadily increased and March ended with an unprecedented peak in clean flows from east to west, totaling nearly 5 million tonnes with MR tankers losing their share of the business. In January-April 2023 (image 5, right chart), the share of LR2 tankers was nearly 60% compared to 20% for Panamax tankers and 11% for MR2 tankers.

III. Vessel Supply Market Trends
A look at vessel supply for Jubail, Saudi Arabia, with Max ETA 14 days ahead, image 6, shows that in April there was relatively low supply between the middle and end of the month, which caused market prices for LR2 AG to rise to levels of WS180 and above. However, in early May, the number of vessels jumped to 30 and above, reducing the previous firmness of LR2 rates. The recent increase in vessel supply fuels uncertainty about rate trends, although demand sentiment and clean oil flows offer optimistic potential for the outlook for LR2 market rates.
 Image 6: Vessel Supply, LR2 AG
Latest AIS since: Maximum number of days from latest AIS received. Trade: This selection includes all vessels competing for cargoes in the selected trade: i. Vessels that are currently in this trade. ii. Vessels that are willing to compete for this trade. Market deployment: Market deployment based on Signal Ocean information. Market Rates: Market rates for the relevant route. Commercial Status: Commercial status of the vessel at each point in time. Max ETA: ETA window for available vessels to reach the loading port 14 days. **Last 90 days:**Number of days back (from today) to start the chart.
IV. Clean Demand Ton Miles
The optimistic outlook for the LR2 segment can be clearly seen in the year-over-year growth in tonne-miles (image 7), as the trend is consistently higher than in any month last year, while the MR clean segment shows a downward trend in May after peaking in February. At the end of the first quarter of the year, the challenge of substituting Russian oil products for LR2 tankers is developing positively with growth in tonne miles from all areas to all destinations.
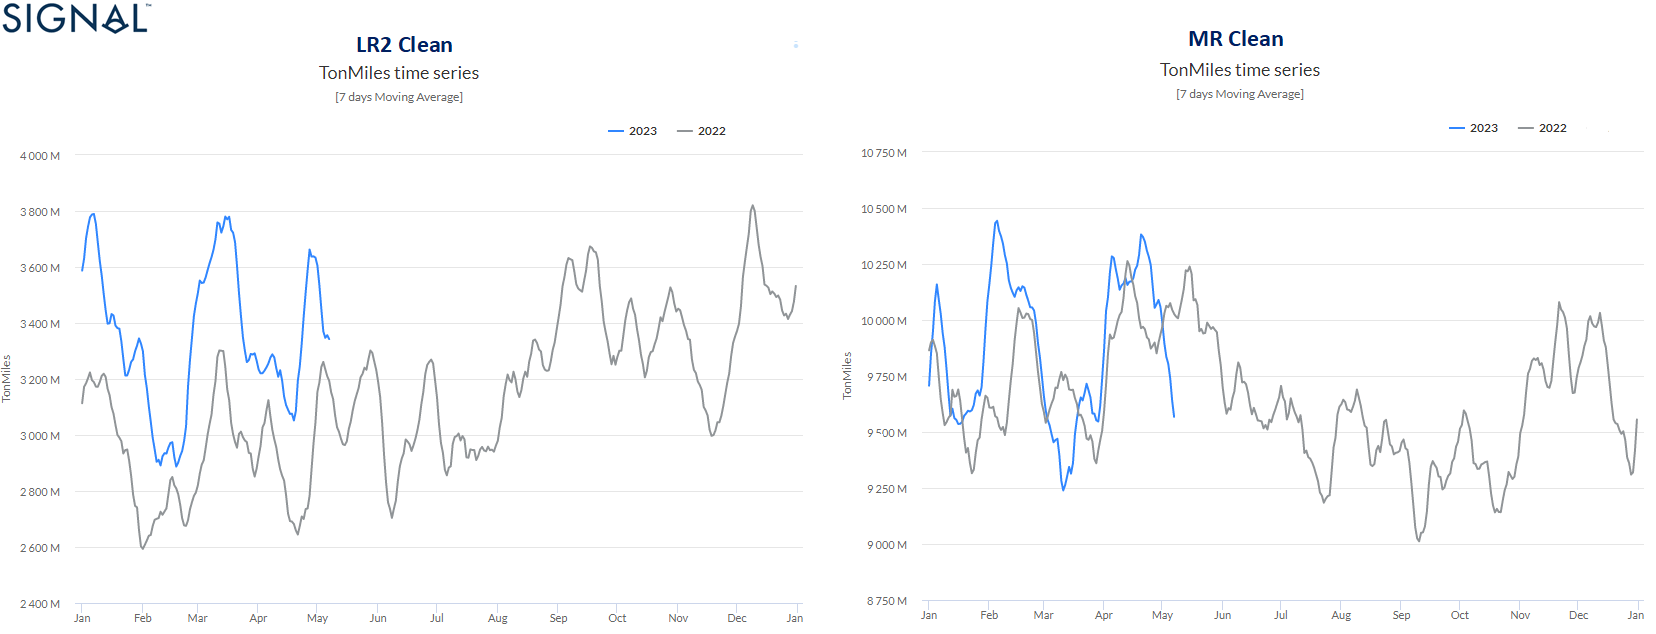 Image 7: Clean Demand Ton Miles, LR2 and MR tanker size class categories
The increase is even more surprising if we focus on the evolution of ton-miles for LR2 tankers from the area AG to Europe, while in the case of MR we still see a strong decrease, confirming the increasing share of employment for LR2 tankers from East to West. (image 8)
![]() Image 8: Clean Demand Ton Miles, AG to Europe
Image 8: Clean Demand Ton Miles, AG to Europe
Looking ahead, it is a clear trend that exports from East to West will increase mainly due to LR2. Therefore, we maintain an optimistic outlook for LR2 market prices and a more conservative approach for MR, as growth in clean demand in ton-miles appears to be declining in the case of the MR size. The Arabian Gulf region will continue to play a critical role in substituting Russian petroleum products as demand on the continent leads ton-mile growth, while the United States is also a major destination for clean petroleum product exports from Saudi Arabia. It remains to be seen how clean freight rates will develop in the second half of the year and the extent to which Europe will continue to substitute Russian oil for clean petroleum products, as energy demand has increased more than in previous years. The clean tanker segment LR represents a size in terms of supply and demand that offers growth opportunities in the AG trade, while it remains to be seen whether the smaller clean tankers will gain strength from trading other light and medium clean oil products.
Stay tuned for more freight analysis in the dirty and clean tanker segments.
Frequently Asked Questions
What is driving LR2 clean tanker demand in 2023? The EU ban on Russian petroleum products, effective February 2023, shifted European clean product imports to Arabian Gulf suppliers. This rerouting significantly increased ton-miles for LR2 tankers on the AG-to-Europe trade lane, with Saudi Arabia and India emerging as the dominant origin countries.
Why are LR2 tankers outperforming MR tankers on East-to-West flows? LR2 tankers are capturing a larger share of East-to-West clean flows due to the scale of volumes required to replace Russian supply. In January–April 2023, LR2s held nearly 60% of vessel class share on these routes, compared to just 11% for MR2 tankers.
What does Signal Ocean data show about LR2 freight rates? Signal Ocean's market assessments show LR2 AG rates stabilized around 150 WS in early Q2 2023 — well below the Q4 2022 peak above 300 WS, but with supply-demand fundamentals that reduce the risk of a repeat of the February lows. Signal Maritime monitors these trends through daily AIS-based vessel supply data and market rate assessments.
Which European countries are the top destinations for clean tanker flows from the East? The Netherlands leads at 40% of clean product shipments from the East, followed by France (35%) and Belgium (24%). Demand from these Continent ports accelerated sharply after the February 2023 EU ban and price cap on Russian petroleum products.
How can I access Signal Ocean's clean tanker market data? Signal Ocean provides live freight rate assessments, oil flow analytics, vessel supply tracking, and ton-mile demand charts for clean and dirty tanker segments. Contact The Signal Group to request access. You can read our previous story for the Aframax crude tanker segmenthere.
Follow our Weekly Market monitor on supply, demand and freight rates here.
For subscription to our FREE weekly market trends email, please contact us: research@thesignalgroup.com.
For the latest updates and insights, visit the Signal Ocean Newsroom.
Explore Signal Ocean's Clean Tanker Intelligence
The Signal Group provides real-time freight market intelligence powered by Signal Ocean — covering LR2, MR, and Panamax clean tanker segments with data on rates, flows, ton-miles, and vessel supply. Request a demo to see how Signal Maritime intelligence can support your bunkering and freight decisions.
-Republishing is allowed with an active link to the source


Ready to get started and outrun your competition?


.png)


.png)


.png)

.png)

.png)


.png)


.avif)


.avif)


