


drives these stories

The U.S. responded to the Russian invasion of Ukraine by imposing sanction measures targeting not only the core infrastructure of the Russian financial system but also the shipping industry. The US Department of Treasury’s Office of Foreign Assets Control (OFAC) expanded debt and equity restrictions on 13 main Russian enterprises.
The impact on the freight industry can not be ignored for crude oil trading as earlier news of this week added further tension following U.S. sanctions on Russian ships. The announcement for sanctions on five ships owned by PSB Leasing, a subsidiary of Russia’s Promsvyazbank Public Joint Stock Co, created intense fears for shipowners considering loading crude from Russia. Asian crude buyers are worried about their purchasing of supplies. However, U.S sanctions are not yet targeting Russian fossil fuel exports, while there is increased pressure from Northwest Republicans on Biden to boost U.S. oil and gas production and proceed to sanctions on Russian energy exports.
Russia's oil and gas industry is the backbone of its economy, but there are concerns that there will be intense disruption in the global economy if energy sanctions are imposed, while the global world is still trying to recover from the COVID-19 pandemic. Before the Russian-Ukraine war tensions, global oil supply struggled to meet demand, driving oil pricing sentiment to high levels. The last few days, the war crisis escalated oil prices to astonished levels. Crude oil prices topped $105/bbl early on Monday 28th of February for the first time in more than 7 years, and up by 50% compared to last year’s prices. In the natural gas market, prices increased by 35% to €119/MWh and the EU, which imports around 40% of its natural gas supply from Russia, is already on plans to plot a strategy to end its reliance on Russian energy. Germany announced its movement to freeze the Nord Stream 2 gas pipeline designed to double the gas flow from Russia to Europe, as reported in Reuters from Sarah Marsh and Madeline Chambers, however, other pipelines in the European Union remain operational.
Agricultural wheat and corn prices also increased on the prospects of a potential major supply shortage in global grain markets. European leaders are already under plans to unveil a strategy to break dependence on Russian gas. However, this transition will not be in one day and will take years with implications for crude oil demand and oil prices.
The first round of the existing sanctions puts at risk commercial shipping operations in the Black Sea and potentially the Baltic area (Primorsk -Ust Luga range). The question for the shipping industry lies on the present and future implications following the first round of negotiations between Russia and Ukraine with no ending agreement except to keep talking, while all eyes are on the energy and grain markets.
Freight market, port operations, seafarers’ dynamics, marine fuel prices, commodity prices, new trading flows on the dry and wet market are some of the key elements that are under monitor as we are progressing with the increased war tension. Ukrainian ports have already been closed till the Russian invasion ends, while many shipping companies have suspended sailings to Black Sea ports.
Cargo Activity - Ports, Russian Federation
There is an increased risk on cargo flows from Russian ports despite the existing reluctance of the West to impose sanctions on Russian exports. The current situation provokes a potential threat on the Russian economy for SWIFT sanctions that could damage the country’s major banks that typically manage transactions with foreign buyers of Russian exports and eventually lead to disruptions in commodity flows.
Graphs 1 and 2 with The Signal Ocean Platform data visualize the volume of cargoes at major port hubs for dry and wet cargoes in the Russian Federation during the last year, where we can see the vessel sizes that could be significantly influenced by the existing tensions in the scenario of restrictions on cargo flows from Russian key ports.
In the tanker segment, (Graph 1) we can see the importance of the Aframax segment in Russian exports, actually amounting to 47% share of the total at the ports Primorsk, Ust-Luga grasped and 30% at Novorossiysk. It is interesting to note that at the Kozmino, the Aftamax size grasped the 90% share of cargoes, while at the other ports of Vysotsk, Saint Perterburg, Kavkaz, Obskaya Bay, MR1 tankers held the lion share of activity with percentages of 60%, 70% 40% and 86% respectively.
 Graph 1: Signal Ocean Data| Year 2021, Cargoes Activity, Per Tanker Vessel Size and Port, Russian Federation
In the bulker segment, (Graph 2) we see that the Capesize size has a minor share in the cargo flows per Russian port, while smaller vessel sizes, Handysize - Supramax along with the Panamax are heavily influenced by the activity of coal, grain and other minor dry cargoes mainly at Ust-Luga and Novorossiysk. The below graph indicates about 20% share of cargoes for the Supramax vessels at Novorossiysk, while for Handysize vessels is 60%.
 Graph 2: Signal Ocean Data| Year 2021, Cargoes Activity, Per Vessel Size and Port, Russian Federation
Given the above influence of cargo flows on vessel sizes per port, our below analysis monitors the freight market situation on the tanker Aframax size, where we see an intense level of impact in the Baltic freight rates and supply trend at Primorsk, Kozmino and Novorossiysk. In the bulker segment, the Supramax size is in the spotlight with Med/Black Sea to Far East supply trend in a rapid decrease and high volatility on freight rates under the fears of grain disruptions.
Freight Market - Tanker
The last few days we experienced a stronger momentum of tanker rates in the Aframax segment, where Baltic to Europe rates are on a remarkable rise. Following the announcement of US sanctions on five Russian ships as response to the Ukraine invasion, the supply of ships in the Baltic route has started to show a sharp decrease with owners reluctant to send their ships to Russian ports and crude buyers struggling to find their ship for seaborne transportation. In two days, rates tripled as the expanded Russian-Ukraine tension is boosting further the sentiment with the supply of ships on decrease.
Image 1 from the The Signal Ocean Platform visualizes the rapid acceleration of rates in the period of one week in the Baltic route with the supply of ships on decrease. The supply trend monitors the number of vessels with max ETA in the next 14 days at the load port of Novorossiysk, Russian Federation and latest AIS signs of five days.
 Image 1: Signal Ocean Data| Aframax Supply Trend, Novorossiysk, Russian Federation, Market Deployment: Relet-Spot, Afra-Baltic Rates, Commercial Status: Available, Max ETA 6 days, Latest AIS since 5 days
The availability of ships at base loading ports of Primorsk, Kozmino with ETA in the next 10 days implies that there is a potential of around 16% removal of vessels of Russian interests at Primorsk, 7% at Kozmino. It is interesting that at the current availability of vessels at Novorossiysk, there is 0% with vessels of Russian interests. The current supply trend with the percentages of capacity removals is a strong signal that could lead Aframax freight rates to new highs in the next few days.
.png) Graph 3: Signal Ocean Data| Supply, Market Deployment: Spot, Relet, ETA next 10 days, Latest AIS since 5 days
Graph 3: Signal Ocean Data| Supply, Market Deployment: Spot, Relet, ETA next 10 days, Latest AIS since 5 days
In the scenario of U.S. sanctions on Russian energy exports, Europe and the U.S. will need to replace the supply scarcity with other sources that eventually will increase the demand ton miles growth and sustain the euphoria of freight rates. Looking at the current evolution of demand, tondays growth we can see in image 2 with The Signal Ocean Platform data that there is an already an increasing pace compared to the lows before the Russian invasion and the upward trend is going to meet the highs of a similar period last year.
 Image 2: Signal Ocean Data| Aframax Demand Tondays Trend, 2022-2021, Dirty, The TonDays time-series graph presents the laden days of the seagoing and stopped vessels for the user-selected vessel class range that have loaded (Area From) and discharged (Area To) the selected areas. This graph shows the 7 days moving average (MA) of the time series. We define TonDays = Deadweight * VoyageDays and so TonDaysPerDay = TonDays / VoyageDays, where VoyageDays = LastDischargeSailingDate - FirstLoadStartTimeOfOperation.To compute the TonDays time-series, we aggregate for each day the TonDaysPerDay for all the seagoing and stopped vessels.
Overall, we can say that the impact on the freight market seems significant for the crude supply of ships in the aframax size for the Baltic Area and demand ton-days growth as the US and Europe is likely to need to replace around 4million barrels/day in the case of U.S. sanctions on Russian energy exports.
Freight Market - Dry
When it comes to the dry freight market we see the Supramax and Handysize ships to be mainly affected by the overall situation. Supply shortages of wheat will boost demand as Russia and Ukraine are key exporting hubs and along with grain port closures in the Black Sea could drive the freight rates to surprising levels for the first quarter of the year.
The restrictions on Black Sea ports are uncertain when they will be relaxed with shipowners avoiding any employment of ships. According to the Republic of the Marshall Islands (RMI) report, we indicatively mention that commercial vessels are advised to avoid any transit or operation within the EEZ of Ukraine or Russia within the Black Sea, while access to the Sea of Azov through the Kerch Strait is currently blocked by Russian forces. In addition, all Ukrainian ports have been closed by the Ukrainian military. Ports Novorossiysk, Tuapse, Taman, Port Kavkaz (including OPL area), and Crimean ports continue operations in normal manner. It is worth noting that Sea Azov ports are shallow water ports related to the Handysize vessels and we see there a potential window for drastic changes on supply and demand fundamentals of the freight market.
Image 3 with The Signal Ocean Platform data visualizes the performance of Supramax freight rates in the Med/Black Sea over the last days before and after the Russian-Ukrainian war tensions and we can easily see that the sentiment improved significantly after mid-February with the supply evolution of ships at less than 90 vessels. The supply trend at Novo signaled a rapid decrease to around 50 ships, while there is a downward direction of rates as shipowners are avoiding to send their ships at ports of high risk.
 Image 3: Signal Ocean Data| Supramax Med/BSea - Far East Market Rates and Supply Trend
What’s next to be considered as a critical point in the grain market is the potential of sanctions on Russian grain exports, then the key import destination will be China that will lead to an increase in ton miles demand growth for dry bulkers and new increase of rates. At this point, we need to highlight that China has already announced on Thursday that it is lifting the wheat import restrictions on Russia.
The future is yet unknown for the potential impact of sanctions on Russian grain and energy exports, what is known is the present that seems hard to predict as the story is progressing rapidly on a daily basis and the shipping industry is digesting the macroeconomic evolution of events. We are closely monitoring the situation through our weekly updates on the dry and tanker markets, where supply and demand evolution determines the performance of freight rates. We wait to see whether the second round Russian-Ukraine negotiations will lead to an end to this flow of fears and uncertainty for the global economy, commodities and shipping industry.
-Republishing is allowed with active link to source
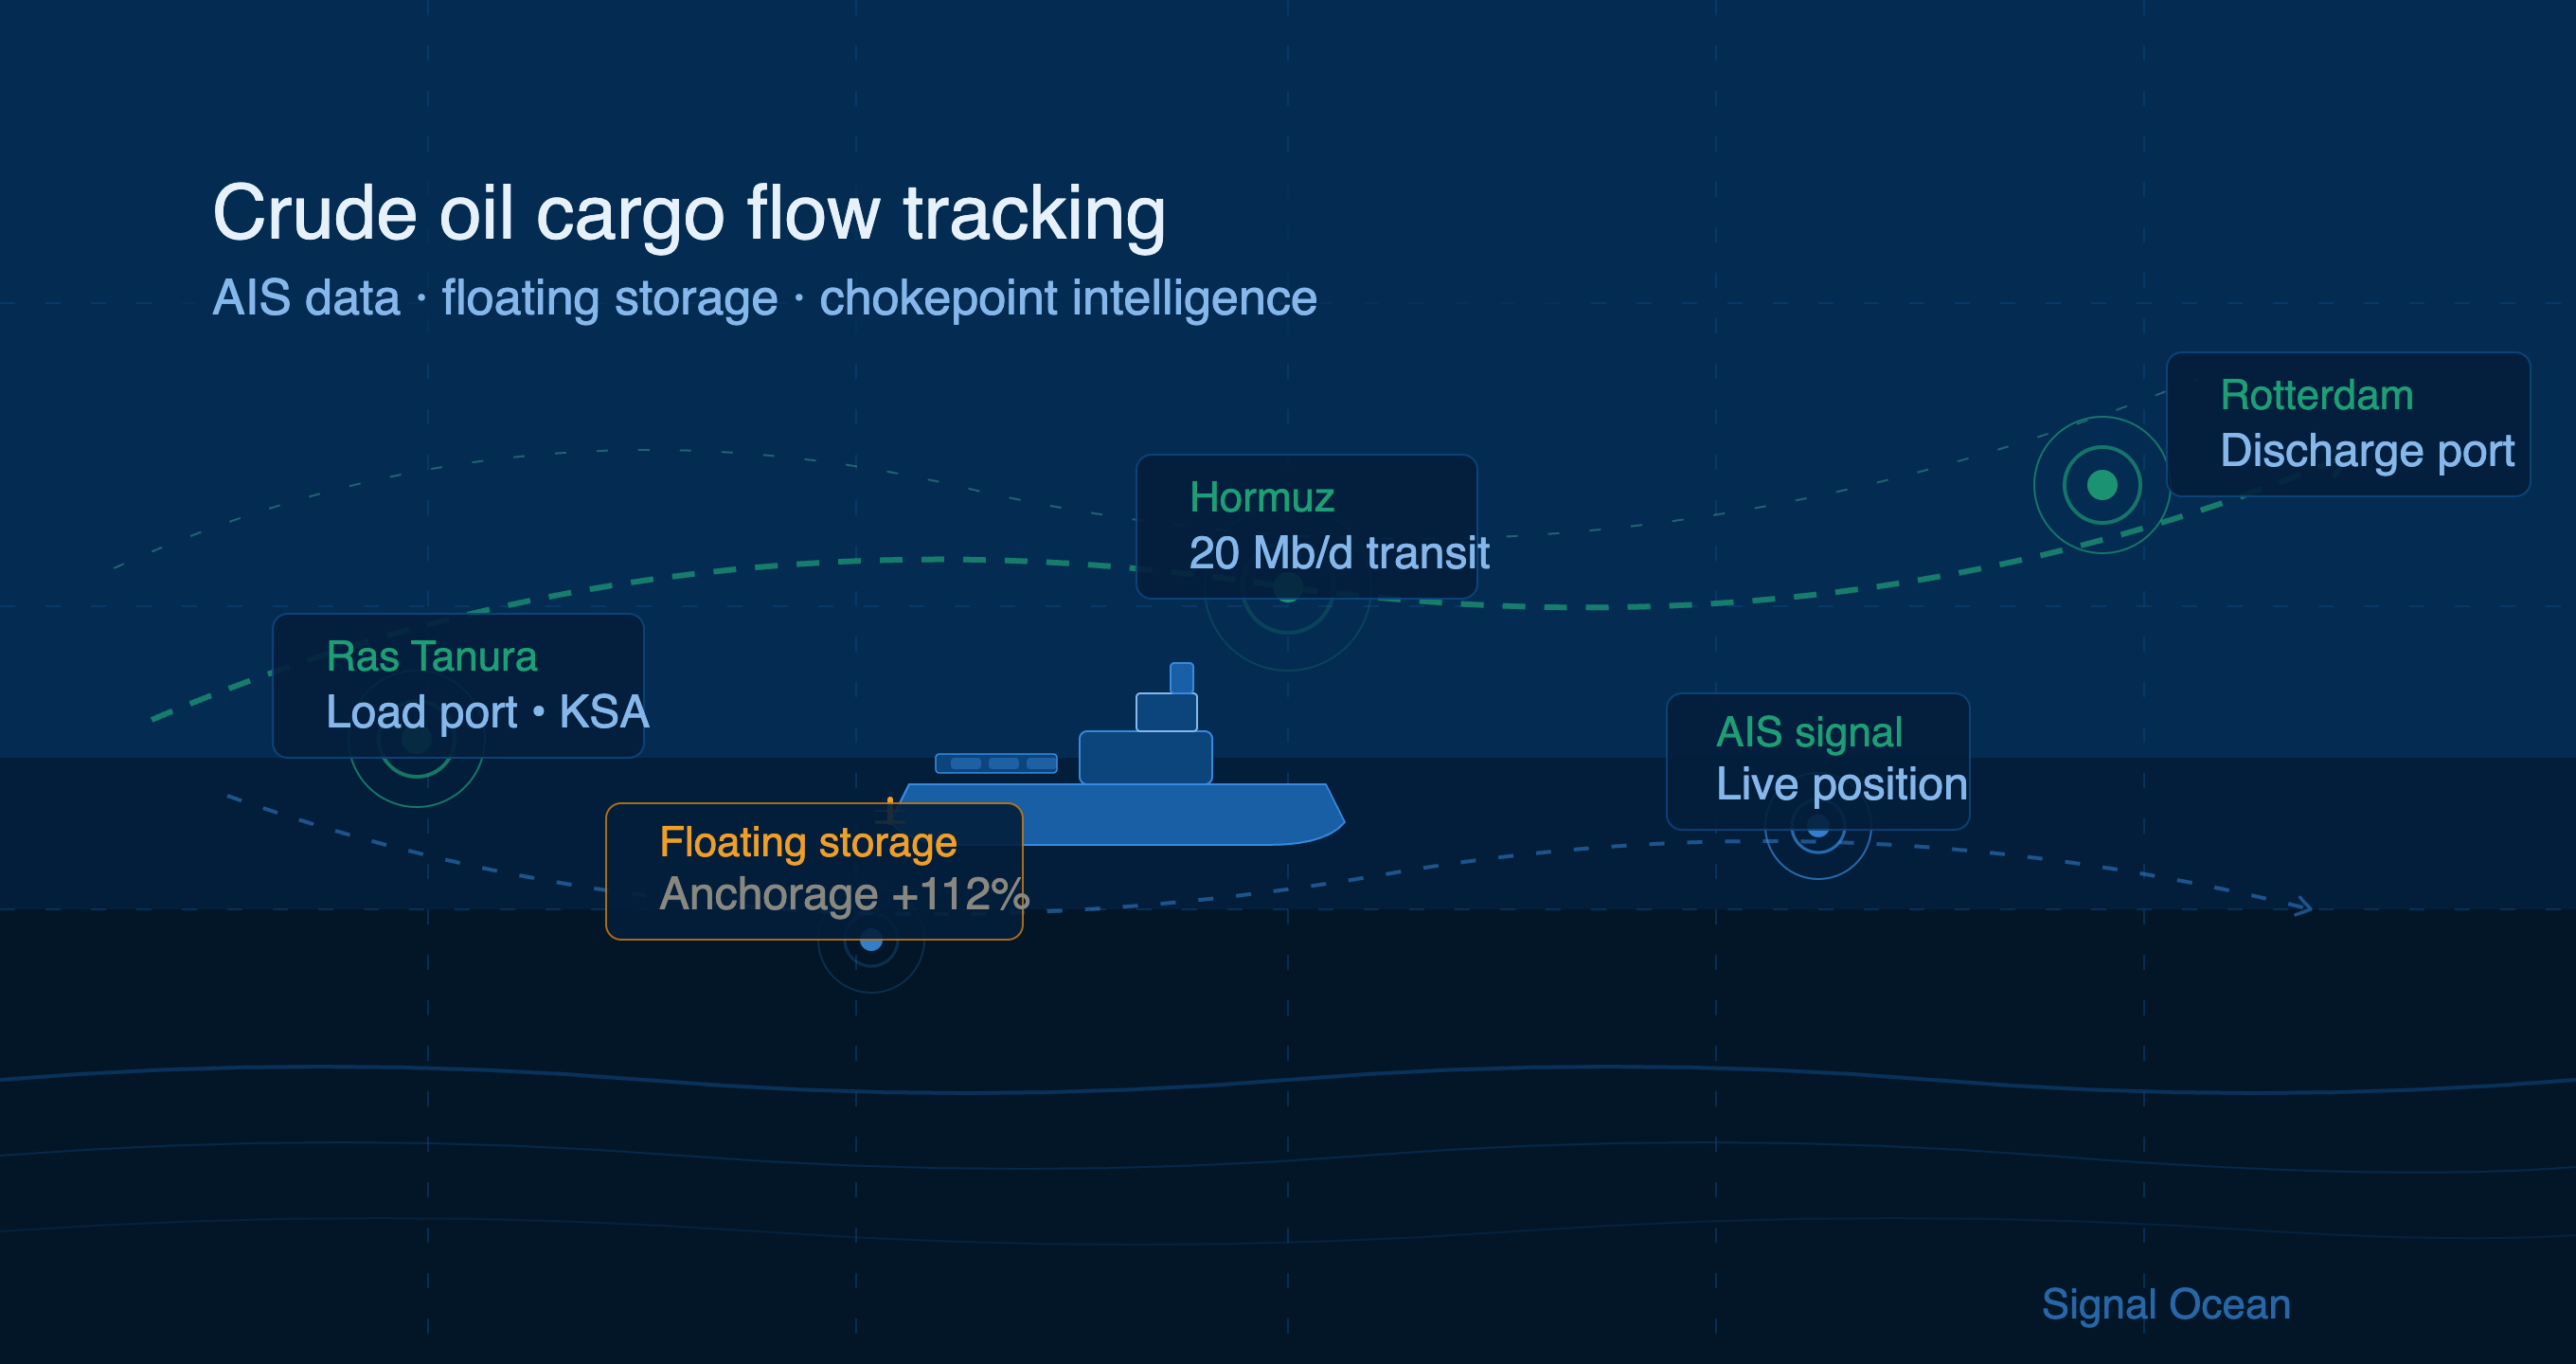
Track Sanctions Impact with Signal Ocean
Signal Ocean's platform delivers real-time vessel tracking, supply-demand analytics, and freight rate intelligence across tanker and dry bulk markets. When sanctions reshape trade flows overnight, Signal Ocean gives operators and traders the data edge to act decisively.
FAQ: Russia Sanctions & Shipping
What sanctions affect shipping? The U.S. sanctioned five vessels owned by PSB Leasing (a Promsvyazbank subsidiary) and imposed debt and equity restrictions on 13 major Russian enterprises via OFAC. SWIFT sanctions further threatened the banking rails used to settle Russian export transactions.
How do sanctions impact freight markets? Sanctions reduce the pool of available tonnage as shipowners avoid sanctioned ports and counterparties. In the Aframax segment, Baltic rates tripled within two days of the initial vessel sanctions as supply at key Russian load ports dropped sharply.
Which vessel types are most exposed to Russia sanctions? Aframax tankers dominate Russian crude export routes from Primorsk, Ust-Luga, and Novorossiysk. In the dry bulk segment, Supramax and Handysize vessels are most exposed through Black Sea grain and coal trades.
Are Russian energy exports currently sanctioned? At the time of this analysis, U.S. sanctions had not yet targeted Russian fossil fuel exports directly, though pressure from lawmakers was mounting. Any energy export ban would require Europe and the U.S. to replace approximately 4 million barrels/day from alternative sources.
What happens to Black Sea port operations under sanctions? Ukrainian ports closed immediately following the invasion. Russian ports including Novorossiysk, Tuapse, and Taman continued operating, but access to the Sea of Azov via the Kerch Strait was blocked by Russian forces, directly affecting Handysize vessel activity.


Ready to get started and outrun your competition?


.png)


.png)


.png)

.png)

.png)


.png)


.avif)


.avif)


