Ship Valuation Review | Industry analysis, ship prices and rates
How Freight Market Cycles Influence Second Hand Ship Values


drives these stories

Dry Bulk Vessel Values Surge as Freight Market Strength Drives Second Hand Ship Transactions
The sale and purchase of ships has recorded an accelerated pace in the volume of transactions for dry bulk vessels compared to 2019 and 2020. The increased volume of ships that changed hands reflects the upward trend of freight rates in the Capesize segment with smaller ship sizes also attracting a high interest from investors. In the wet segment, we are noticing a buoyant sentiment but not of the same magnitude as Chinese growth for the first half of this year boosted Capesize freight earnings to a record high over the last eleven years.
In the tanker segment, drivers of demand for freight rates are standing at weak levels with new virus mutations and outbreaks slowing the recovery in global oil demand. The summer was not supportive for the crude oil shipping industry with earnings fluctuating at loss territory levels, whereas, oil product tankers registered more positive movement in earnings.
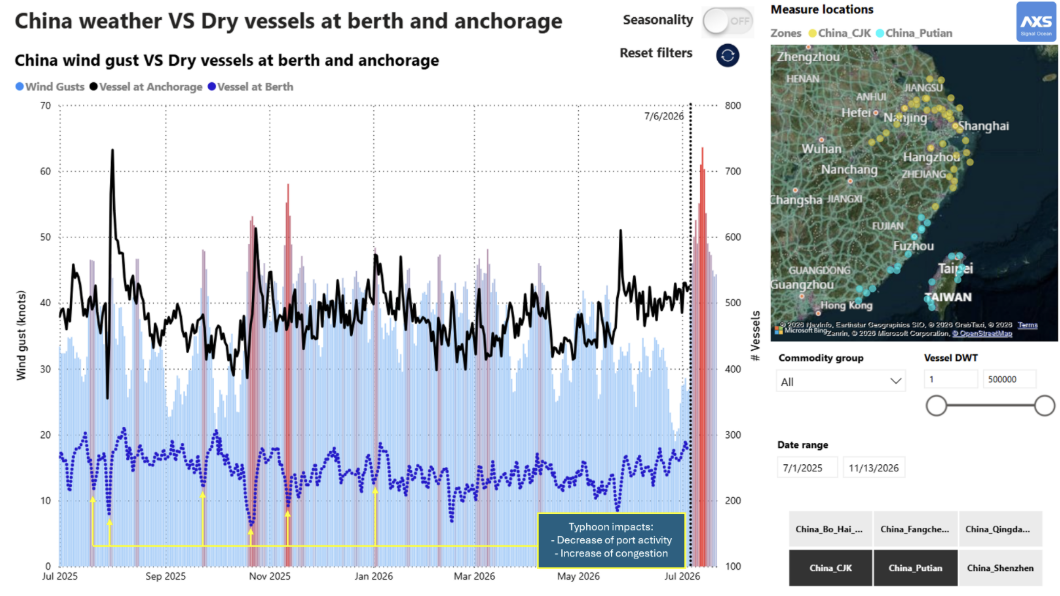
The dry bulk segment continues moving at optimistic levels of performance as the dry freight index is fluctuating above the barrier of 4,000 points and the third quarter of this year appears to be ending at record peak. The current levels are above November 2009 with Capesize earnings taking the spotlight, however, there are concerns on the Chinese economy that may shake the waters of today’s promising sentiment.
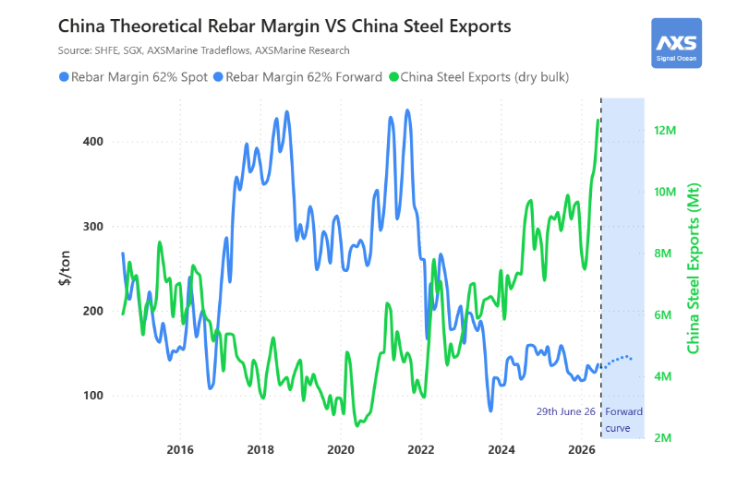
The alarming sign comes from the decrease in Chinese steel output during August. The National Bureau of Statistics showed that Chinese crude steel output fell for a third straight month in August, fetching the lowest monthly rate since March 2020, due to Beijing’s decision on sustaining production curbs to reduce carbon emissions. Official figures showed a 12% year-on-year decline in Chinese steel production to 83.2m tons, which appears to be the greatest since the Global Financial Crisis of 2007 and 2008.
Despite the concerns of the Chinese economy and its potential negative impact on the spot freight market environment, asset investments continue firm with buyers’ eyeing towards modern tonnage. Over the first 8 months, the volume of sale and purchase transactions for bulkers continue to confirm the high willingness of sellers to move ahead with their decisions of selling their assets either for the renewal of their fleet with modern tonnage or exit the market and move ahead with niche investments. Buyers emerge now even more willing to pay a higher price for a second hand bulker of modern tonnage given the prospects of growth of the Chinese economy and iron ore fundamentals.
The optimistic outlook of drivers for supply and demand fundamentals in the dry bulk segment triggered more negotiations between sellers’ and buyers’ that pushed further the upward trend in sale and purchase prices. The concluded sale and purchase transactions throughout the year led to a significant increase in the value of benchmark assessments for bulkers, whereas, in the tanker segment, there is a softer sentiment with sellers trying to boost the sentiment of pricing for their assets. In the long run, owners expect that global oil demand will surge to a solid healthy performing environment driving seaborne transportation and fleet utilization at levels that will eventually support freight market with ship prices to evolve at stronger numbers.
Our review, using Signal Ocean: Ship Valuation methodology, gives a deep understanding of the fluctuations of second hand ship values in parallel to the volatility of the spot freight market with an interesting snapshot of the recent and historical performance on the dry bulk segment.
The first part (I. Benchmark Assessments) emphasizes on the trend of benchmark values for the main age groups 5 -10 year old ships for dry and tankers per main ship size. The second part (II. Estimated Market Ship Valuations), analyzes the evolution of ship valuations for active and inactive vessels, current and historical, per age class category, 0-5, 5-10 and 10-15 year old ships.
I.Benchmark Assessments
Using Signal Ocean benchmark values, we can see the current trend of values in the dry compared to the wet segment, based on the aggregation of a widely distributed list of Sales & Purchases transactions. The benchmark assessments are published weekly at the Signal Ocean Platform for all vessel classes for the main age groups. The price curve of benchmark assessments reflects the pricing sentiment between a willing seller and buyer for a potential second hand sale and purchase transaction.
The image (1) displays the price assessments for dry and tanker vessels classes, as an average value for the period of January - August and the difference of upward movement between the average monthly value for January and August.

II. Estimated Market Ship Valuations | Dry Bulkers in Focus
Using Signal Ocean’s algorithmic approach to Valuations, we can view how the sale and purchase price for dry bulk ships affected the market ship valuations in response to the upward cycle of freight rates during the first 8 months of 2021.
The reports for the benchmark ship valuations capture the vessel age and market component of the price, but in order to examine specifically the current and historical prices for all active and inactive vessels, Signal Ocean estimated market ship valuations process takes into account the specifics of each vessel that make it different from the benchmark vessel valuation that the price curve assumes. The methodology for the calculation of ship valuations is based on main valuation criteria (i.e vessel class, age) with appropriate adjustments taking into account the vessel's engine, fitted with scrubbers, ice class vessel, country built, shipyard built.
Images below capture the overall picture in the evolution of freight market rates for main seaborne routes and estimated market ship valuations per Capesize, Panamax, Supramax and Handysize.
The Overall Picture: Spot Freight Market & Estimated Market Ship Valuations
The plotted line of market rates ($/t) represents clearly the recovery that followed after the second half of year 2020, (image 2). In the Capesize segment, Brazil to North China market rates accelerated at a record pace with the Chinese economy paving the wave, while Panamax bulkers also followed amid the challenges on seaborne Chinese coal imports due to decarbonization efforts. In addition, smaller bulker size sectors performed well due to strong grain fundamentals that attracted investors’ interest for purchasing opportunities in the second hand market.
Freight Market Snapshot

The question is to see the influence of the positive spot freight market volatility on estimated market ship valuations. Image (3) presents an asset valuation report for bulkers, per main class, and how much more expensive a ship of 0 to 5 year old is today compared to a 5 to 10 and 10 to 15 year old ship. The upturn of freight rates is reflected in the steep incline of vessel valuations from 2019 to year-to-date values. It is interesting to see the upward movement in the value of a Capesize modern bulker (0-5 year old) that went up to 42M$ surpassing the barrier of 40M$ during July and August. In the Panamax segment, estimated market ship values reacted with weaker momentum with figures below the barrier of 30M$. For a 0 to 5 year old Panamax bulker, the calculations for the estimated market ship valuation was standing at the end of August only 2M$ above the value of a 0 to 5 year old Supramax.

Vessel Valuation Ratio: Price comparison between a 0-5 and 5-10 year old ship
The upturn in ship valuations appeared simultaneously for overall the segment as the Capesize freight recovery influenced strongly the sentiment and sellers’ price expectations increased for all vessel classes. The image 4 shows the historical evolution of ship valuations from 2019 to the end of summer season and we can see in the second below part that calculations for the estimated market values went up towards the end of the fourth quarter of last year.
Although vessel valuations indicate an upward trend that comes along the same pattern for all main vessel classes, it's interesting to compare the ship valuation ratios between a modern and vintage tonnage. The first part of the image indicates that ratios for Panamax, including kamsarmax, of vintage tonnage 5-10 are now fluctuating at lower figures compared to the highs of 2019-2020, revealing that buyers’ interest is targeting Capesize bulkers and smaller ship sizes. The valuation ratio of 5-10 year old versus 0-5 year old ships is now at an increasing trend that confirms that second hand Capesize, Supramax and Handysize bulkers from 5 to 10 year old ships will be more expensive as the freight market continues to pose profitable levels.

Estimated Market Ship Valuations - Spot Freight Market Volatility
The question is how spot volatility of freight rates influenced the direction of estimated market ship values. In large ship size categories, calculations of estimated values indicate that the upward cycle began in parallel with the gradual recovery of freight rates towards the end of the fourth quarter of last year. However, in the Panamax segment, a significant upward trend is evident over the second quarter of this year. Buyers for second hand Panamax ships appear more convinced of the optimistic outlook of freight market expectations based on Chinese seaborne coal demand. (Image 5)
Capesize & Panamax, 5-10 Year Old Ships

In the Supramax and Handysize segment, the differential compared to Capesize, is that buyers were already in a strong interest of purchasing smaller ship sizes driven by the buoyant grain demand fundamentals. Thus, the trend of vessel valuations was already on the high side. The shifting trend comes in the Handysize segment, where the surprising freight market recovery during the summer season, from June till August, boosted the pricing sentiment of negotiations between sellers and buyers. This flow of demand led estimated market ship valuations to fluctuate significantly above the average value of previous months. (Image 6)
Supramax & Handysize, 5-10 Year Old Ships

Conclusion
The dry bulk freight market gives promising signals not only utill the end of this year but also for the coming quarters. The challenge is whether the Chinese engine growth will continue to be the imminent force of demand fundamentals that will further increase the level of absorbing fleet capacity and maximize utilization ratio. The current outlook outlines that the sale and purchase market will continue at a high volume of transactions that will eventually stimulate further the increasing trend of vessel valuations for bulkers compared to tankers. Modern tonnage is likely to remain in the spotlight and smaller ship size classes will start attracting stronger interest. In a nutshell, the fourth quarter is expected to end at the high trend of market valuations compared to the previous quarters and last year’s trend.
This vessel valuation market report for dry bulk was produced using insights, data and reports from the Signal Ocean platform.
To generate the same insights for your business and learn more about. Explore vessel valuations and freight market analytics directly on the Signal Ocean platfor.
Get fresh and real time reports after signing up to our free edition. We offer a robust Market Intelligence section for all of our users.
-Republishing is allowed with active link to source
FAQ Section
What drives dry bulk ship valuations?
Dry bulk vessel prices are largely influenced by freight market earnings, commodity demand such as iron ore and grains, fleet supply, and investor expectations about future shipping cycles.
Why did Capesize ship values increase in 2021?
Capesize valuations rose due to strong freight earnings driven by Chinese iron ore demand and tight fleet utilisation.
How does freight market volatility affect vessel prices?
Higher freight earnings improve expected cash flow from ships, which increases second hand vessel prices and valuation benchmarks.
How are ship valuations calculated on the Signal Ocean platform?
Signal Ocean valuations combine benchmark sale and purchase data with vessel specific factors such as age, engine type, scrubbers, shipyard and build country.
Request a Demo from The Signal Ocean Platform.


Ready to get started and outrun your competition?


.png)


.png)


.png)

.png)

.png)


.png)


.avif)


.avif)


