Subscribe for our latest news, straight to your inbox:
Thank you! Your submission has been received!
Oops! Something went wrong while submitting the form.
Share this post
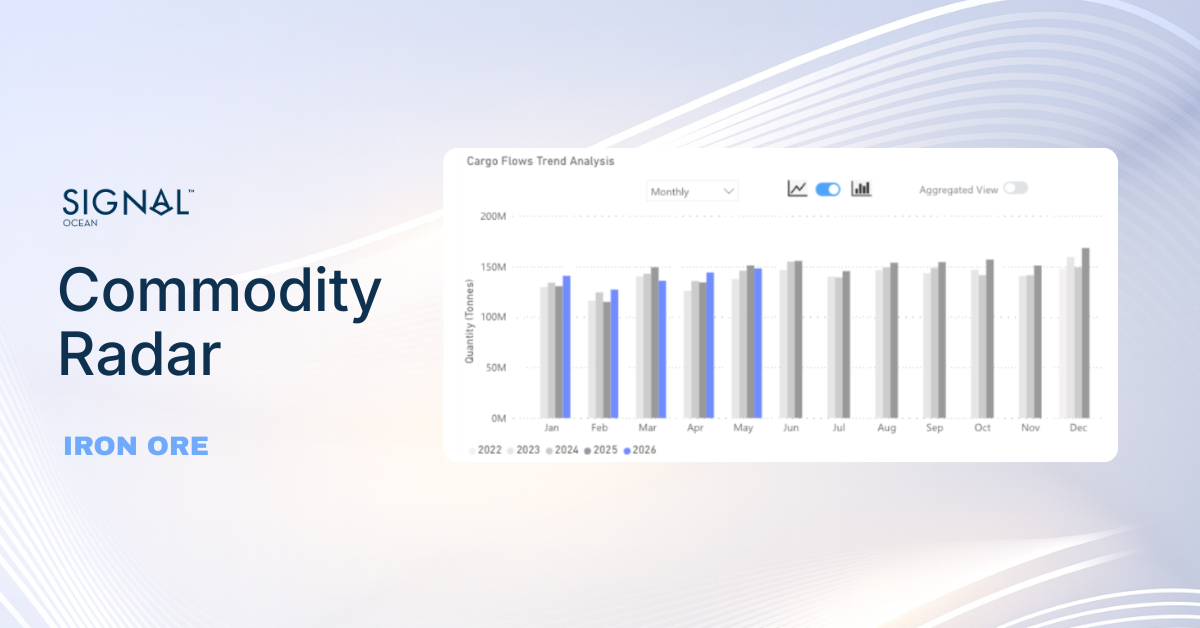
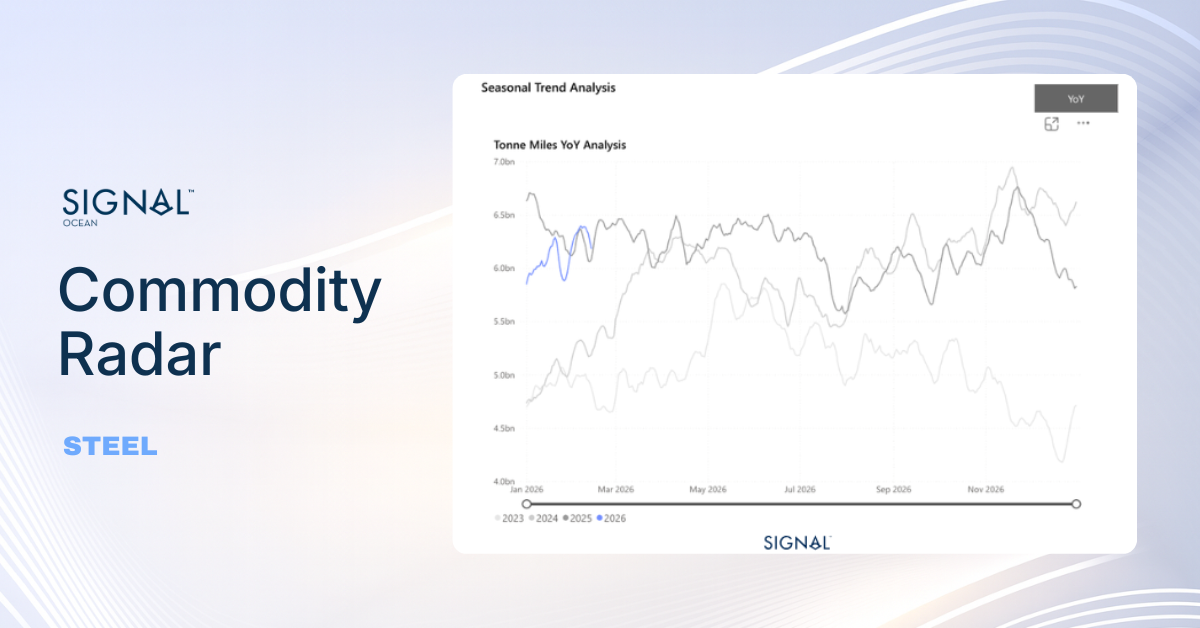
Capesize C3 Route South Atlantic Overview Supply
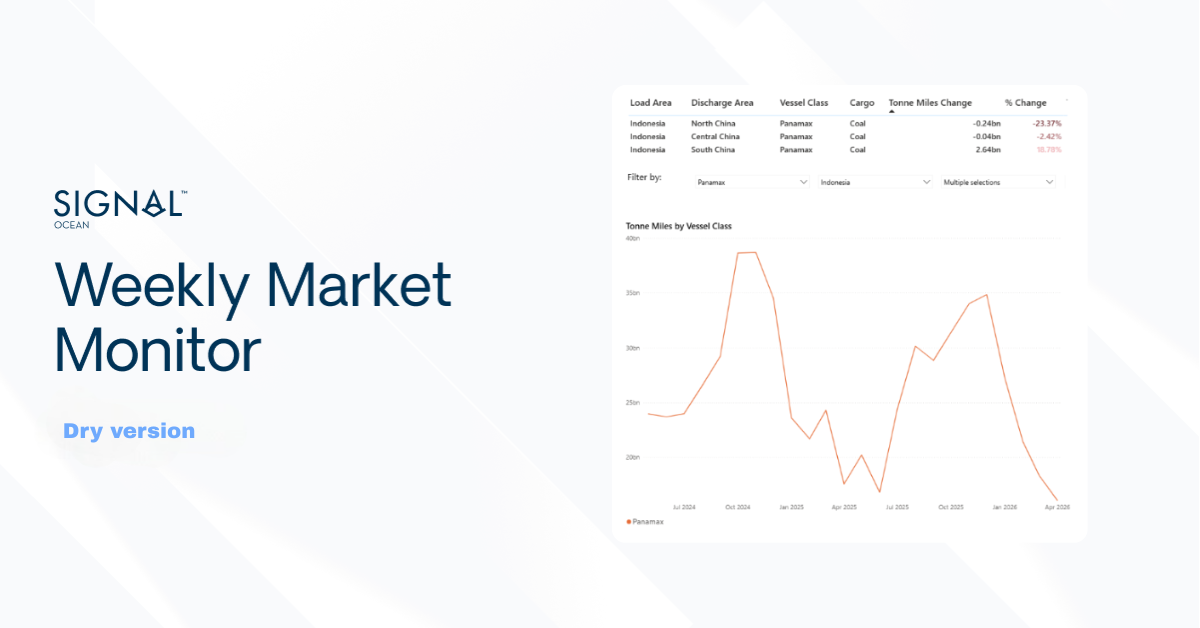
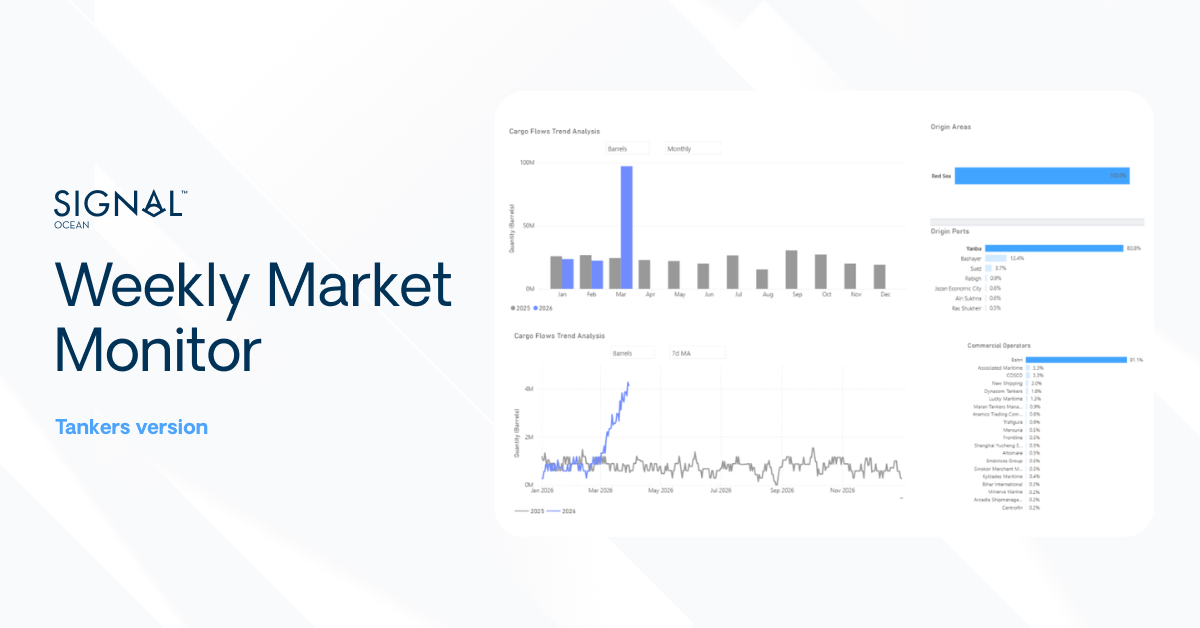
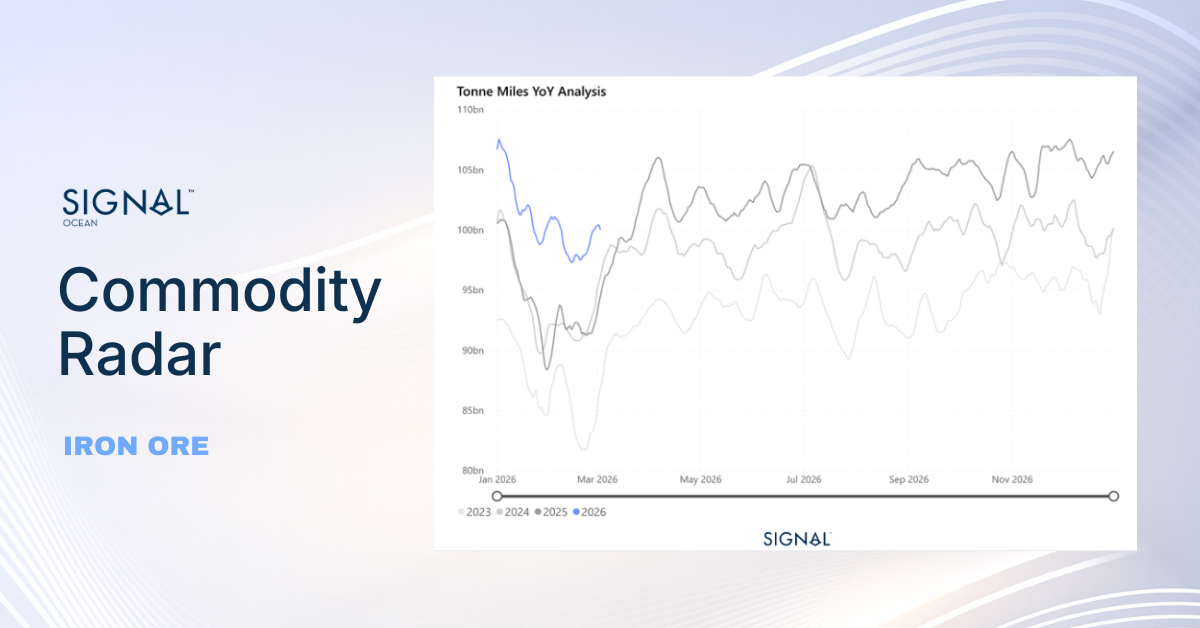
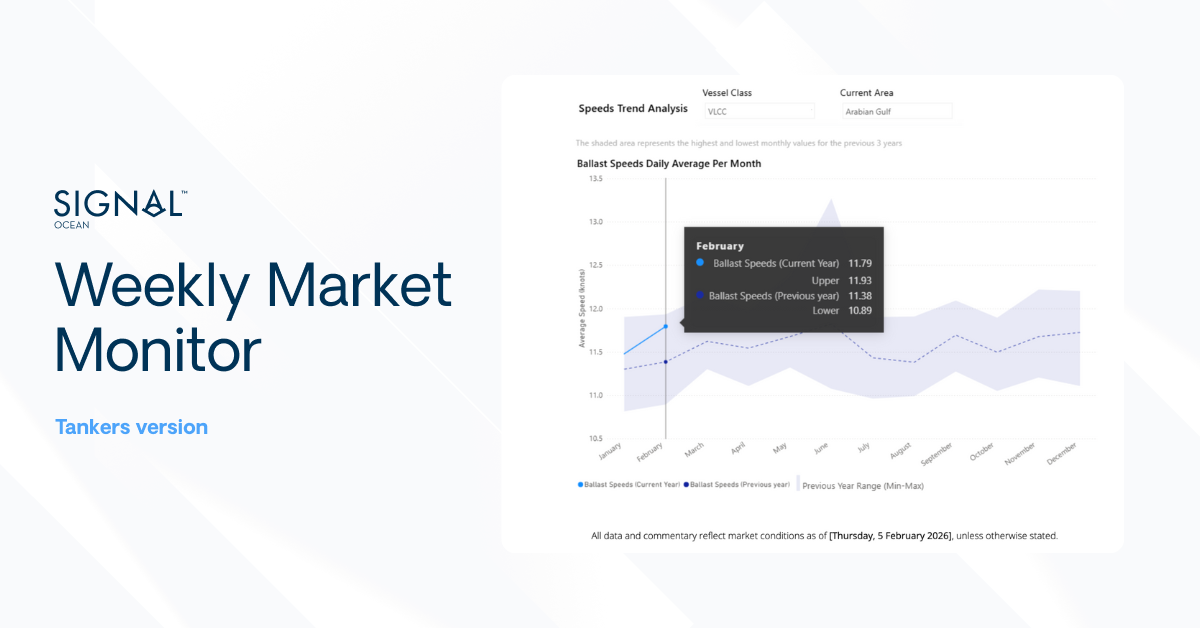
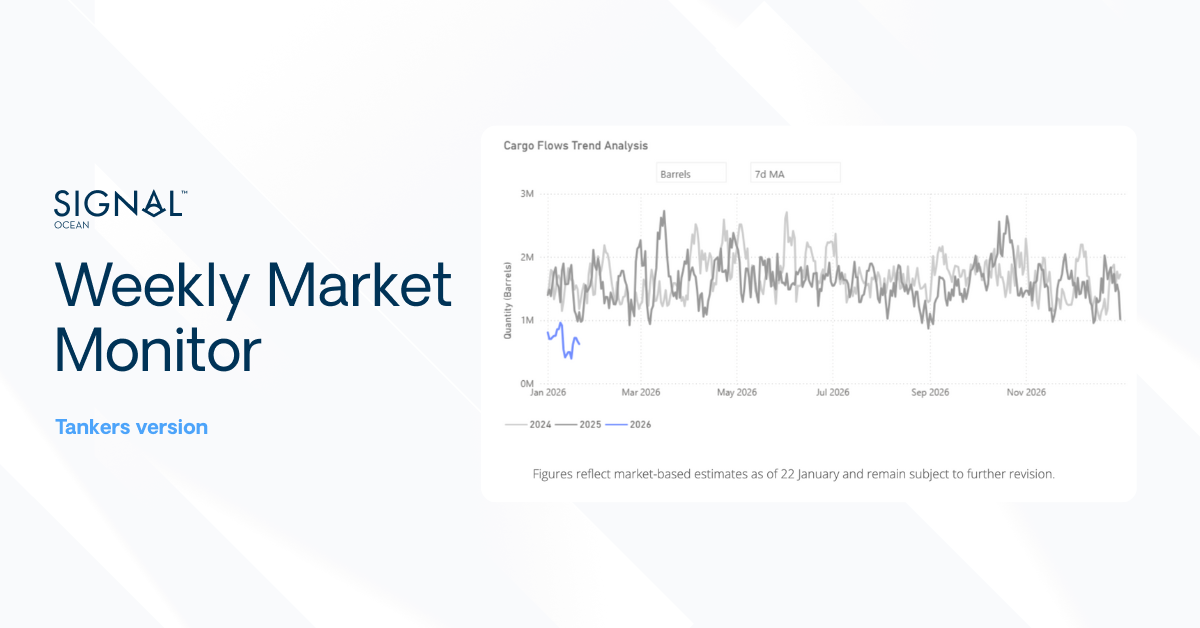
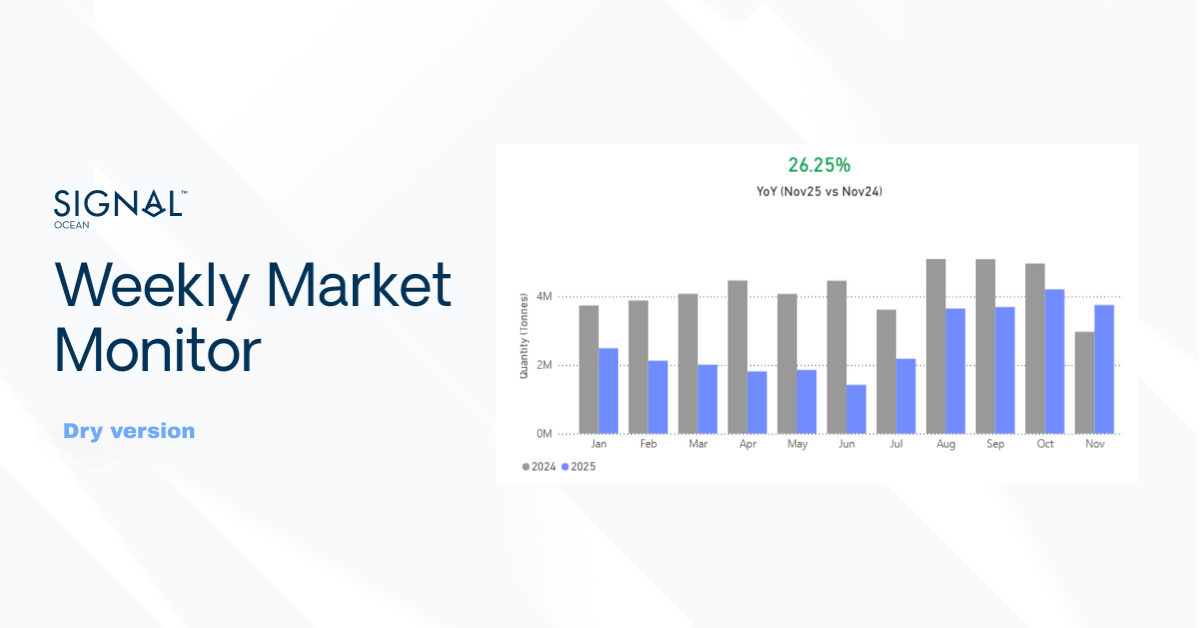
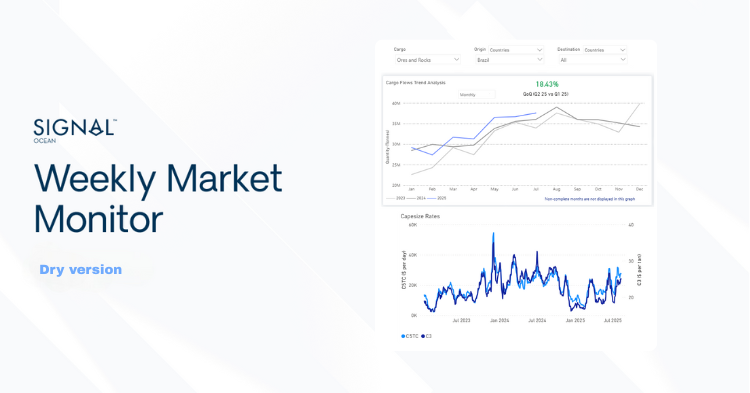
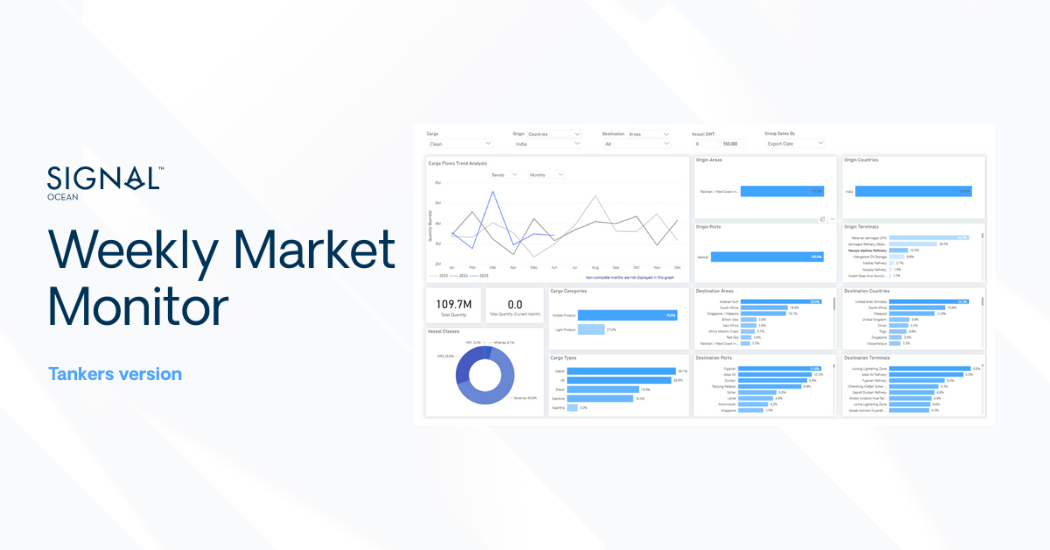
Image 1: Supply Overview, Map for Vessel Arrivals
According to the Capesize C3 South Atlantic overview provided in the image below, during the third week of April, there was a notable 4% decrease in ballast vessels bound for the South Atlantic, coupled with a significant surge of 72 vessels waiting to load. Analysis of forthcoming arrivals in the South Atlantic over the next 40 days reveals a discernible uptick in vessel supply, both laden and unladen, within the 10 to 20-day timeframe. However, beyond the 30-day mark, there appears to be a pronounced increase in the availability of ballast vessels.
Gross supply criteria for the C3 route:
1. Ensure that the Estimated Arrival Time (ETA) to Tubarao is under 40 days.
2. If a ship is heading to the South Atlantic, it's automatically counted.
3. Include Ballast vessels opening in Singapore/Malaysia, Argentina & Uruguay Thailand/Vietnam, East Coast India, and East Africa. If the forecasted load area is South Atlantic or unknown.
4. Include laden vessels opening on the Singapore/Malaysia, Pakistan/West Coast India, and Atlantic or unknown.
5. Exclude vessels with AIS destinations in Australia/ Indonesia/ South Atlantic: Brazil, Africa, Atlantic Coast, South Africa.
Net supply criteria:
Including Available Ballast, Available Laden, Waiting to Discharge and Discharging vessels
Congestion in the discharge areas: North China, South China, Central China, Pakistan/West Coast India, East Coast India, Arabian Gulf
South Atlantic Demand:
Total loading volume (tonnes) from South Atlantic of last 7 days compared with the total volume of previous 7 days. South Atlantic areas: Brazil, Africa, Atlantic Coast, South Africa.
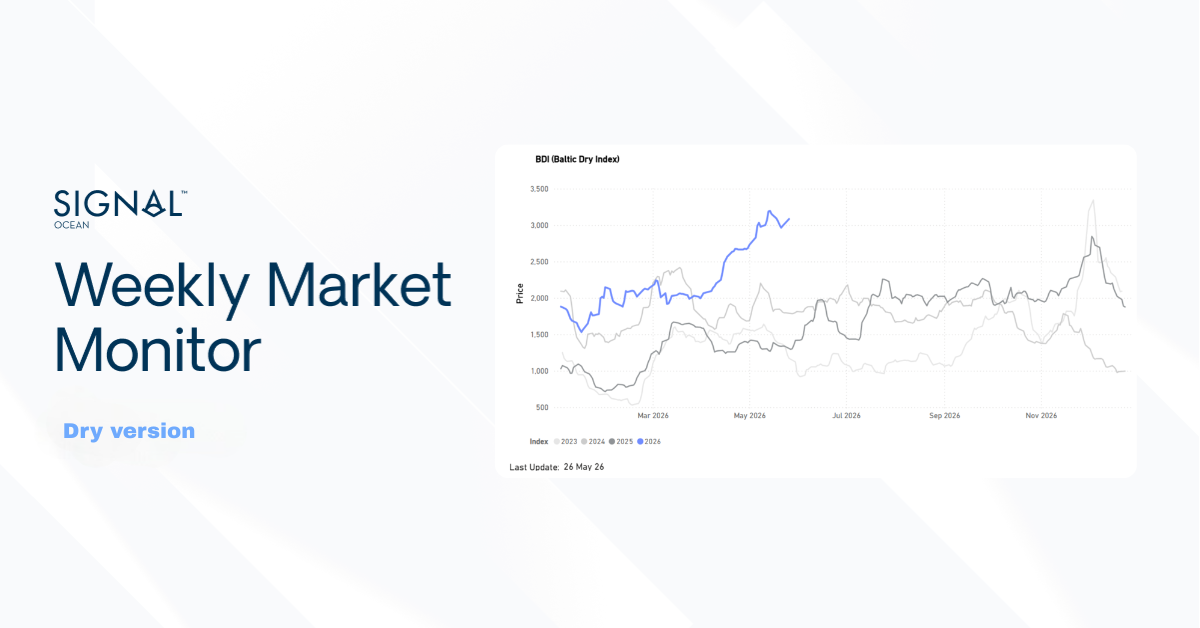
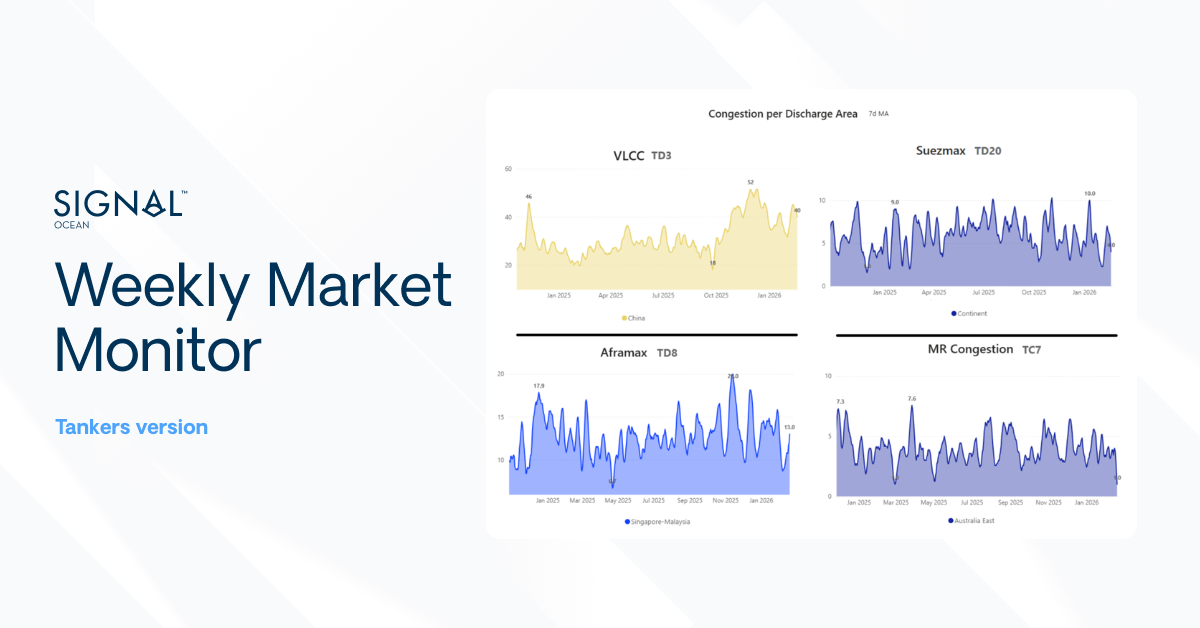
Ballasters to South Atlantic comparison with VLOC
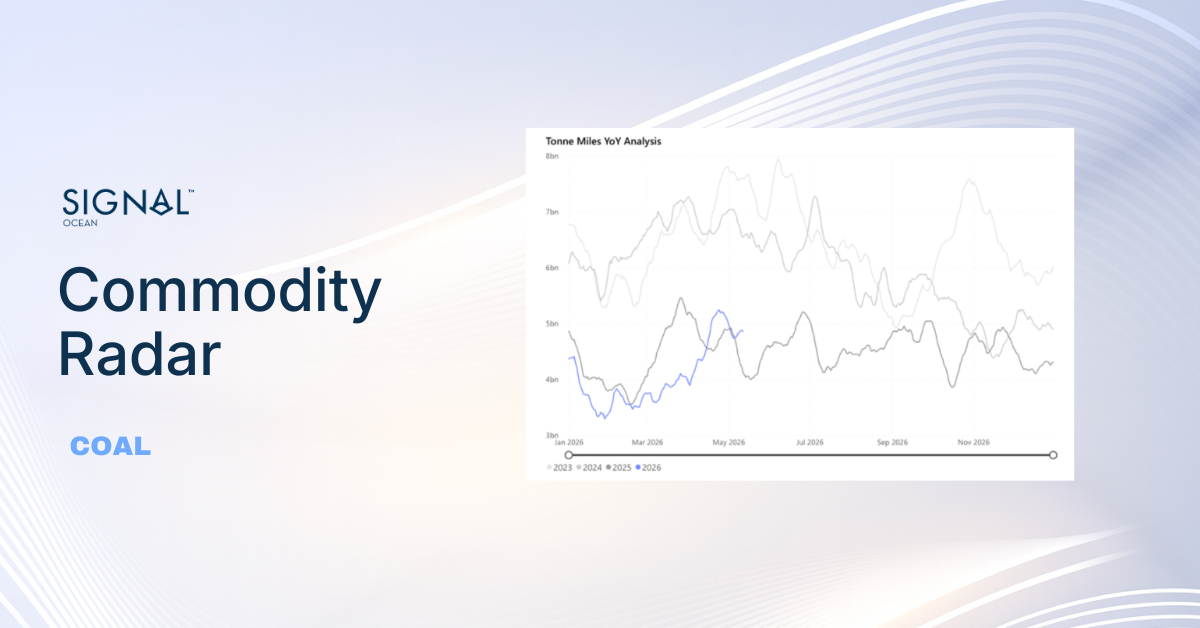
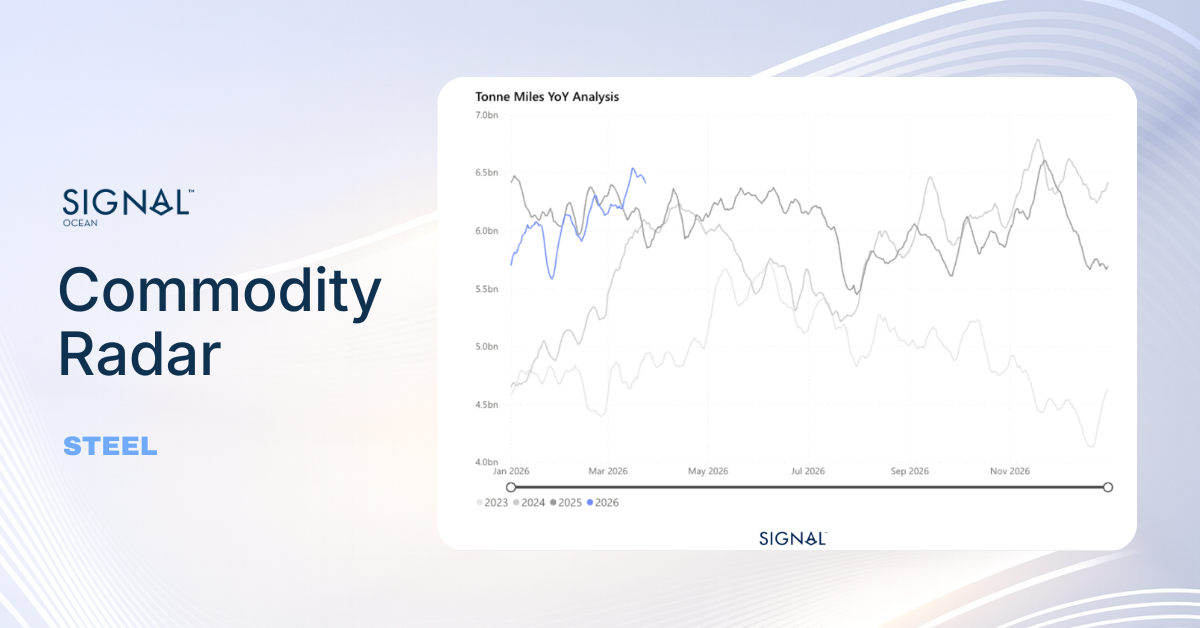
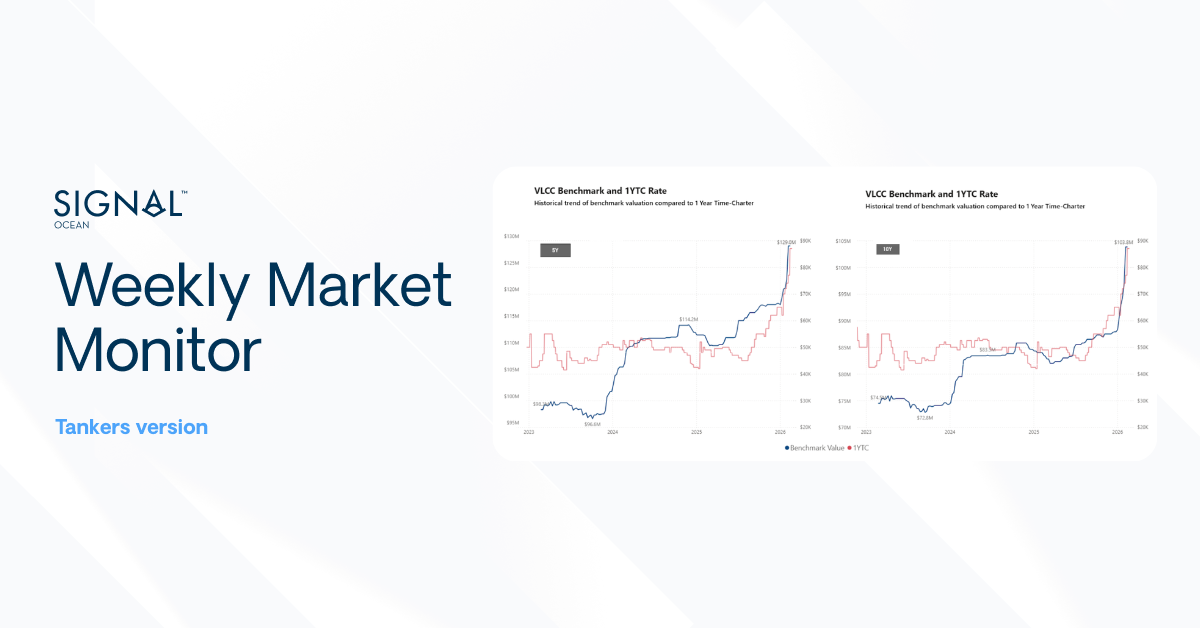
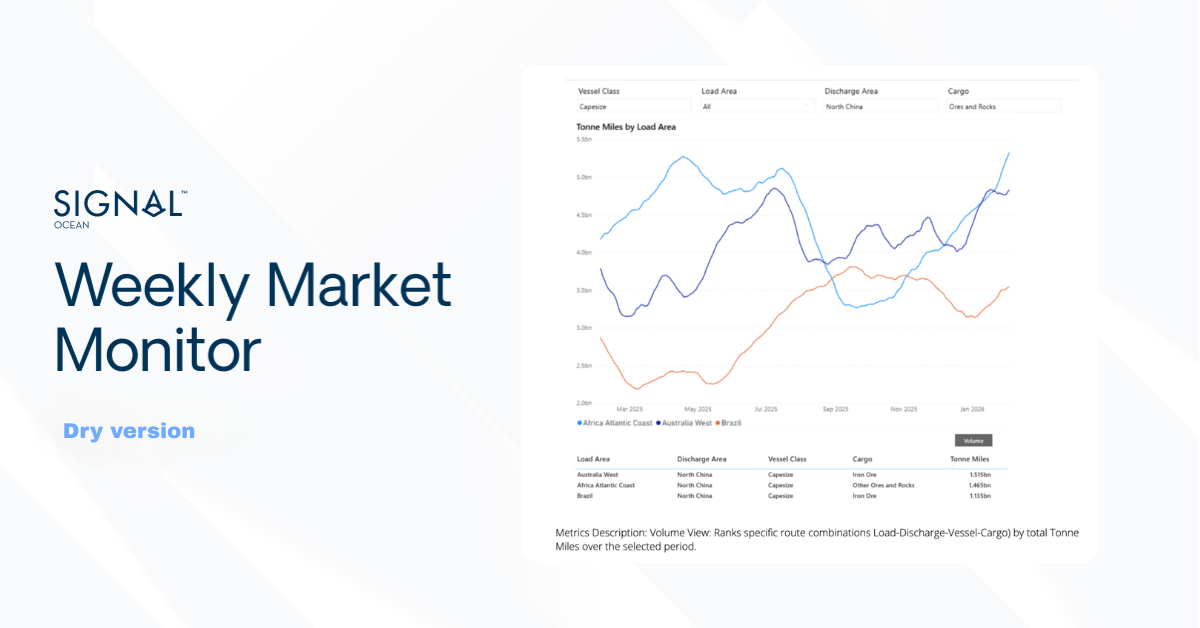
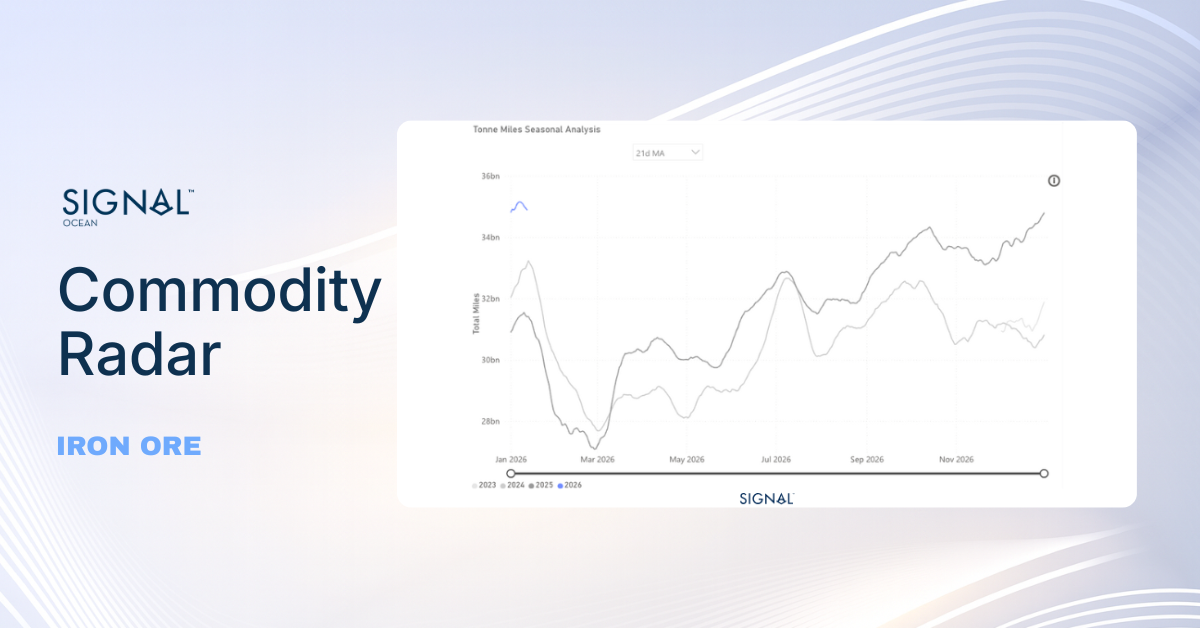
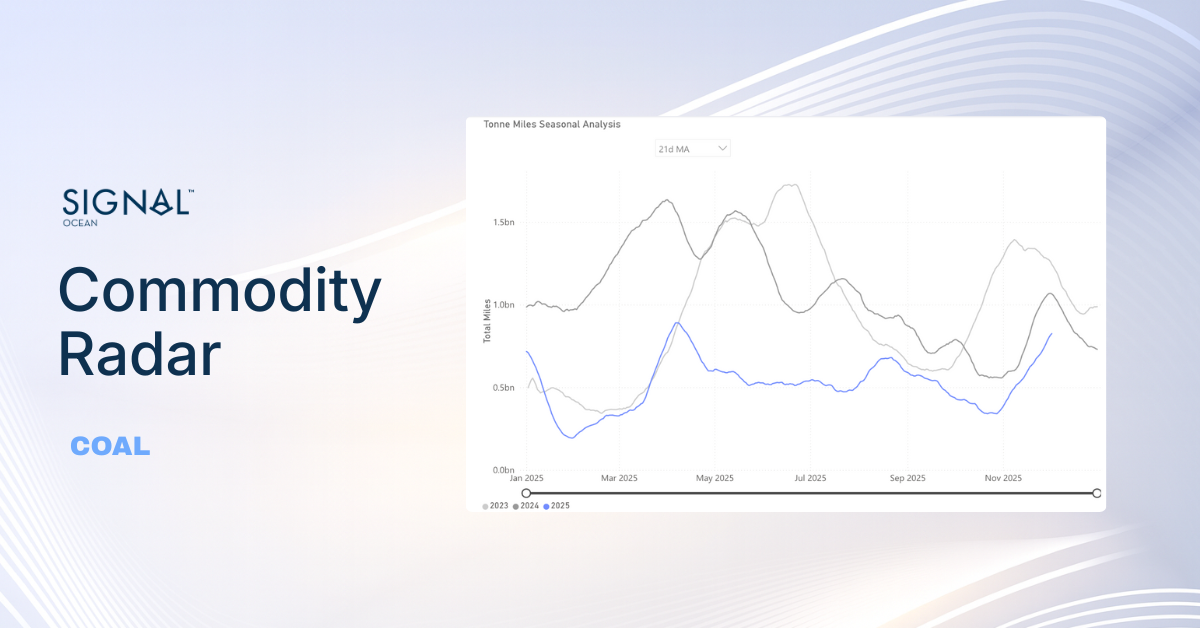
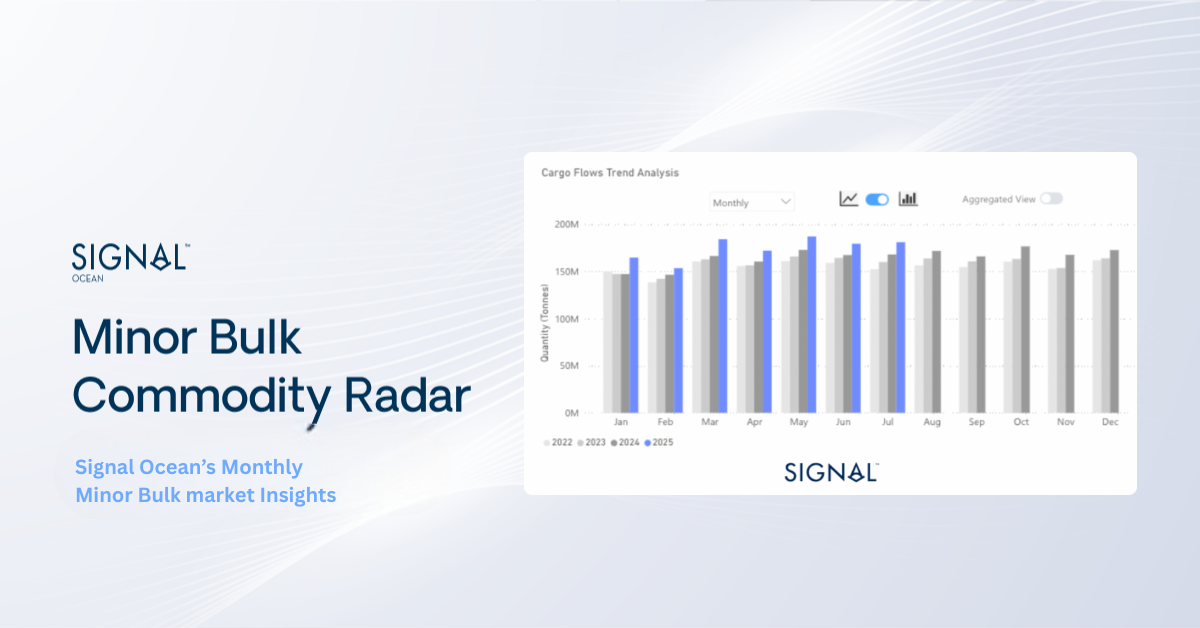
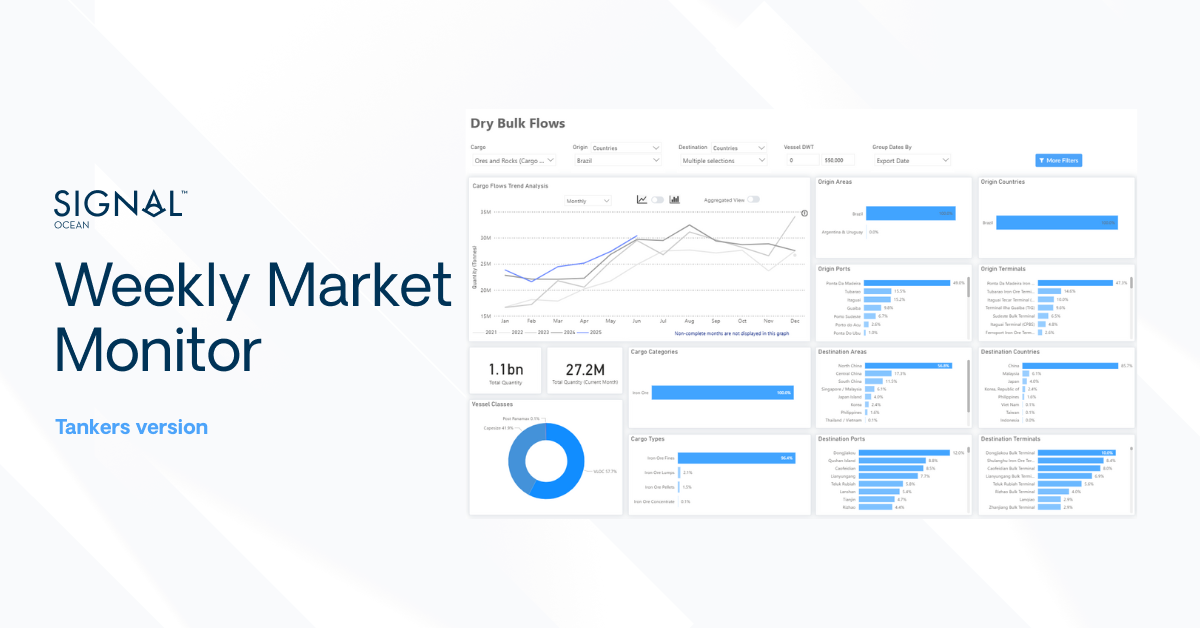
Image 2: Ballasters View, South Atlantic Demand comparison with VLOC
Ballast vessel movement heading towards the South Atlantic in the Capesize sector has recently experienced a downturn, descending from its peak of 250 to below 200. Meanwhile, there's been a noticeable increase in ballast vessels for Very Large Ore Capesizes, as the daily volume loaded in the South Atlantic aims to find stability since mid-March. On the demand side, the outlook is uncertain, characterised by significant volatility swinging between highs and lows. The trajectory of April's demand remains ambiguous, with Baltic rates starting to steady by the conclusion of the third week.
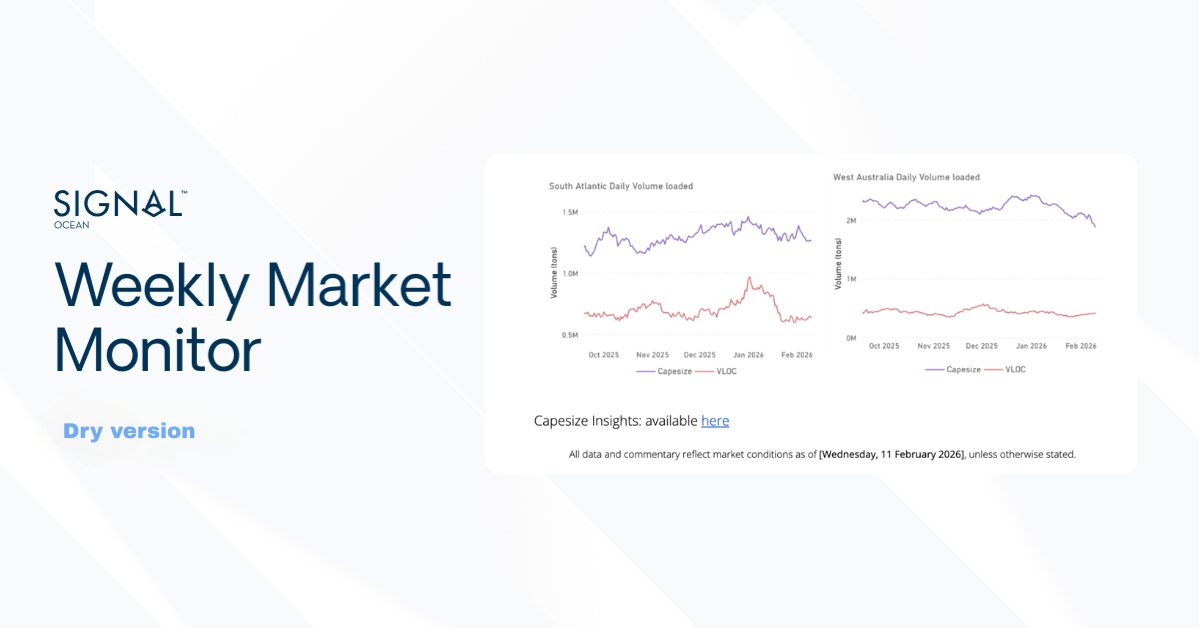
Capesize Ballasters Vs Baltic Rates
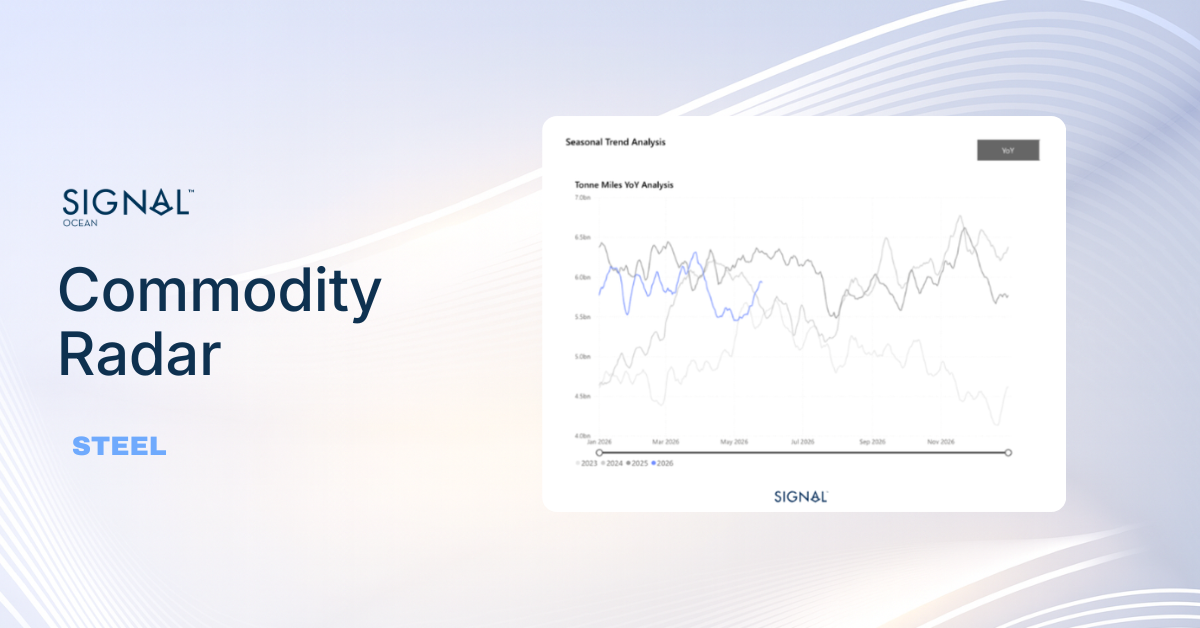
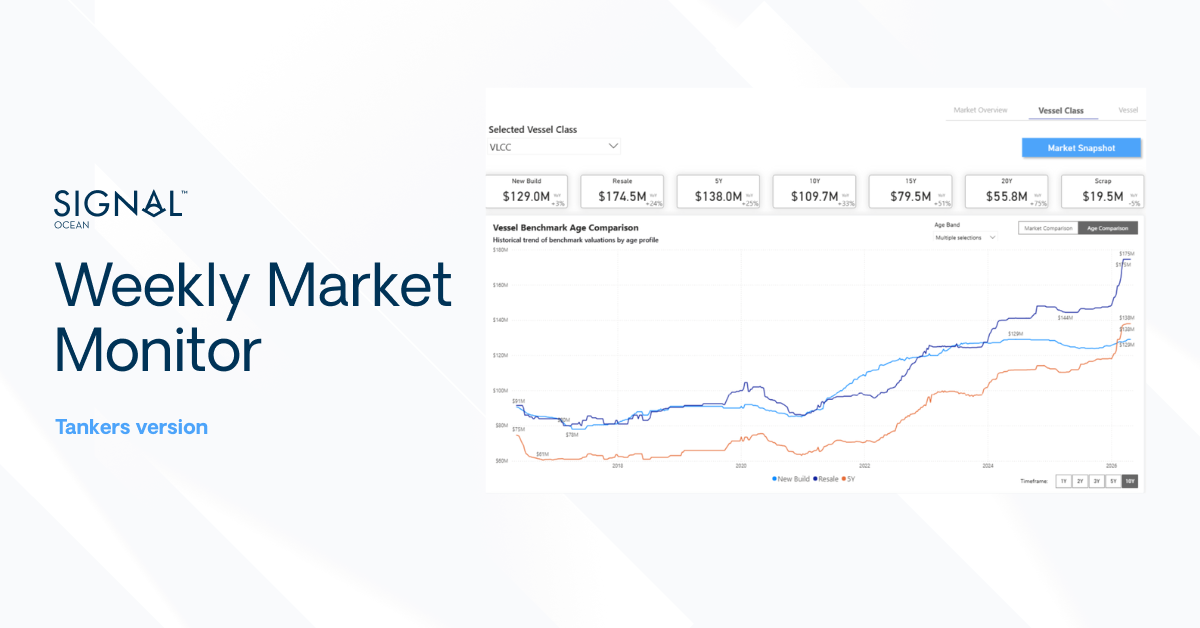
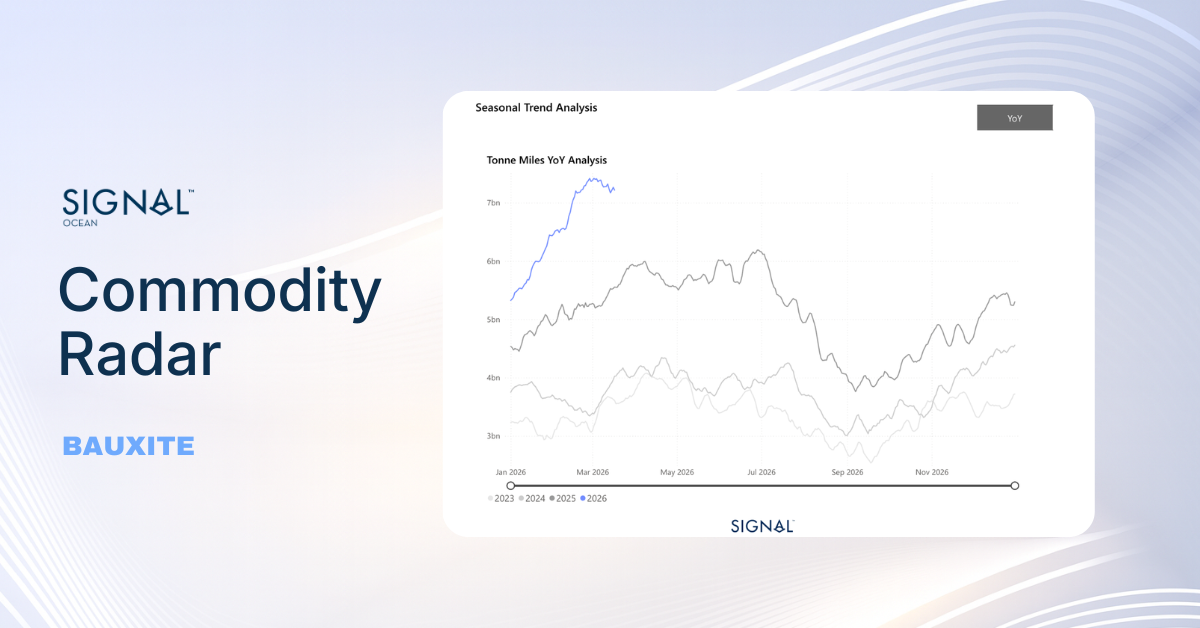
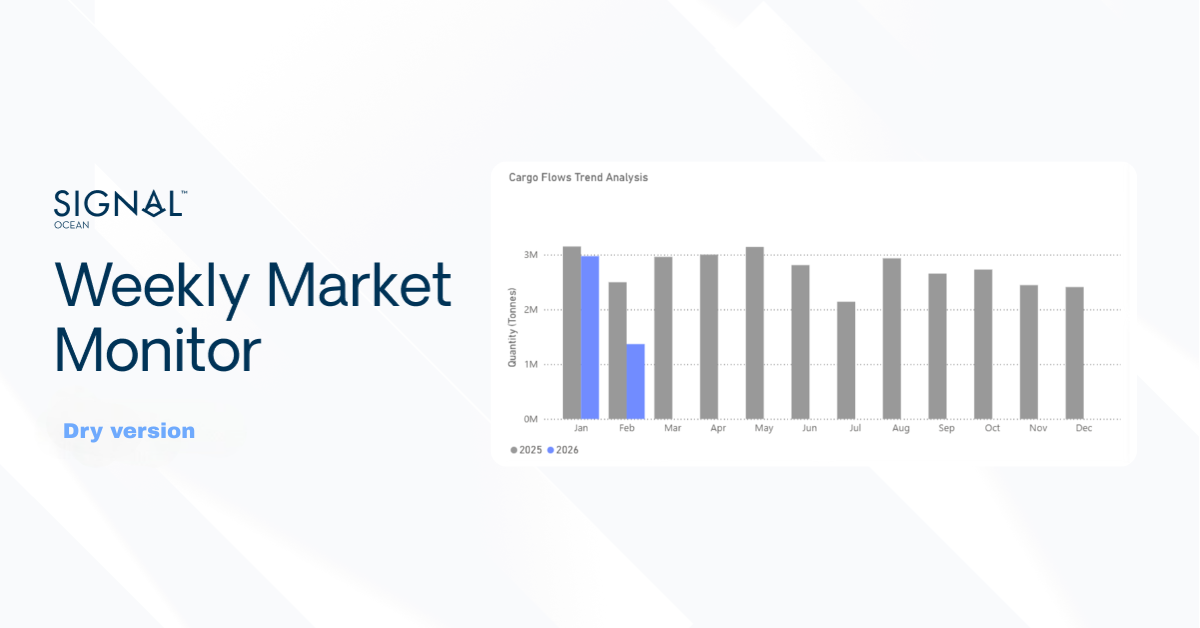
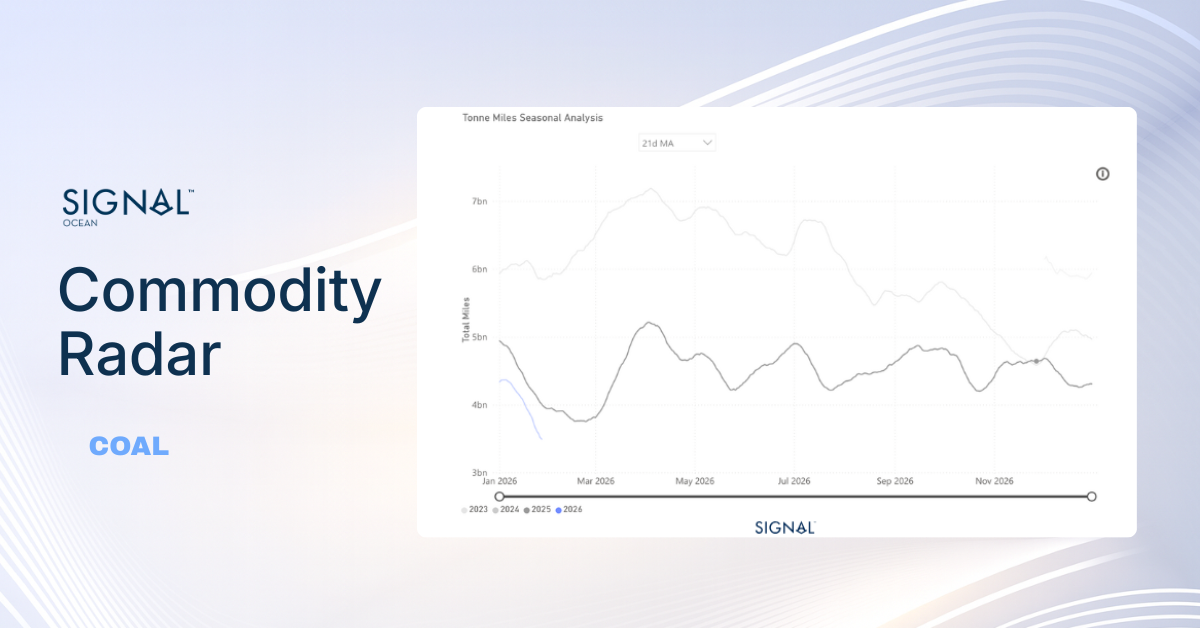
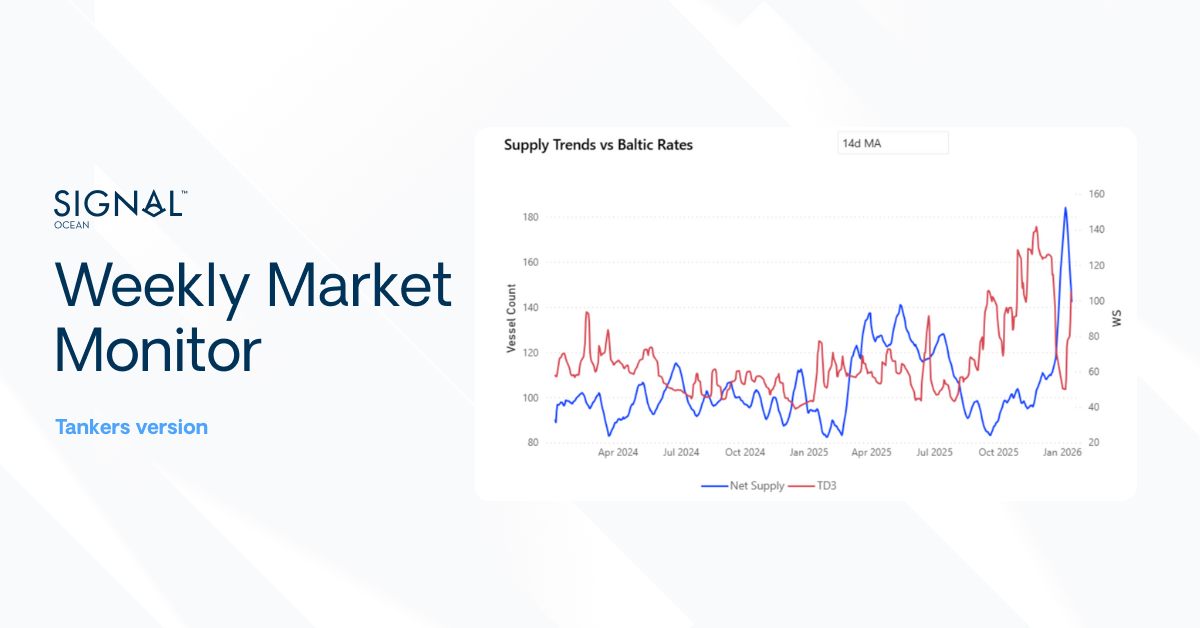
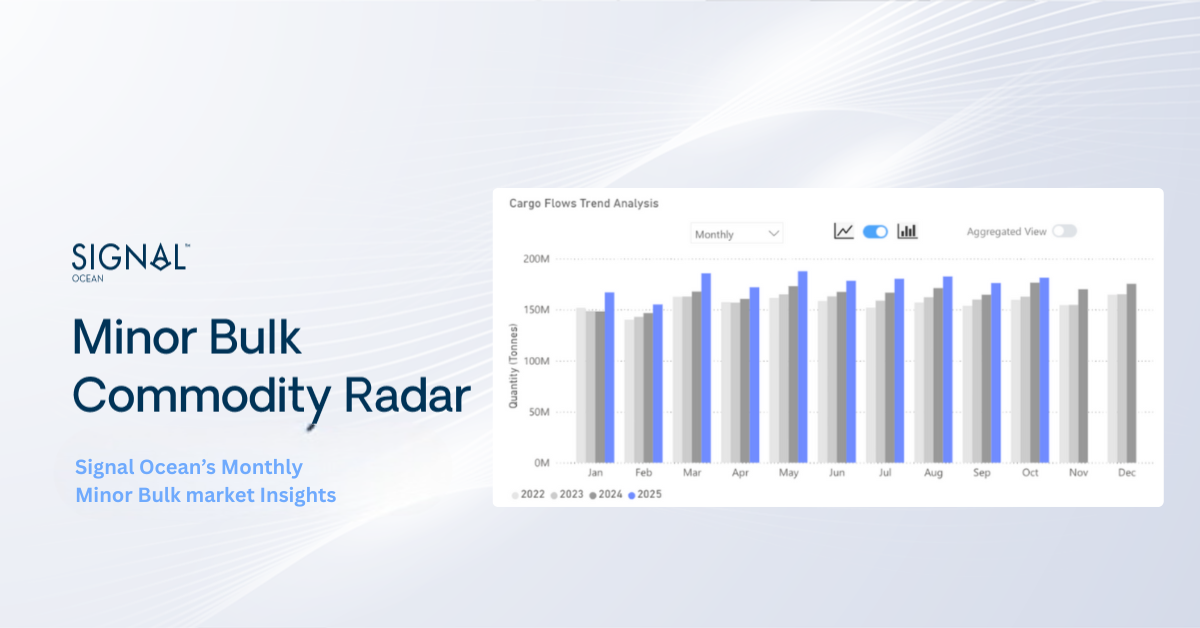
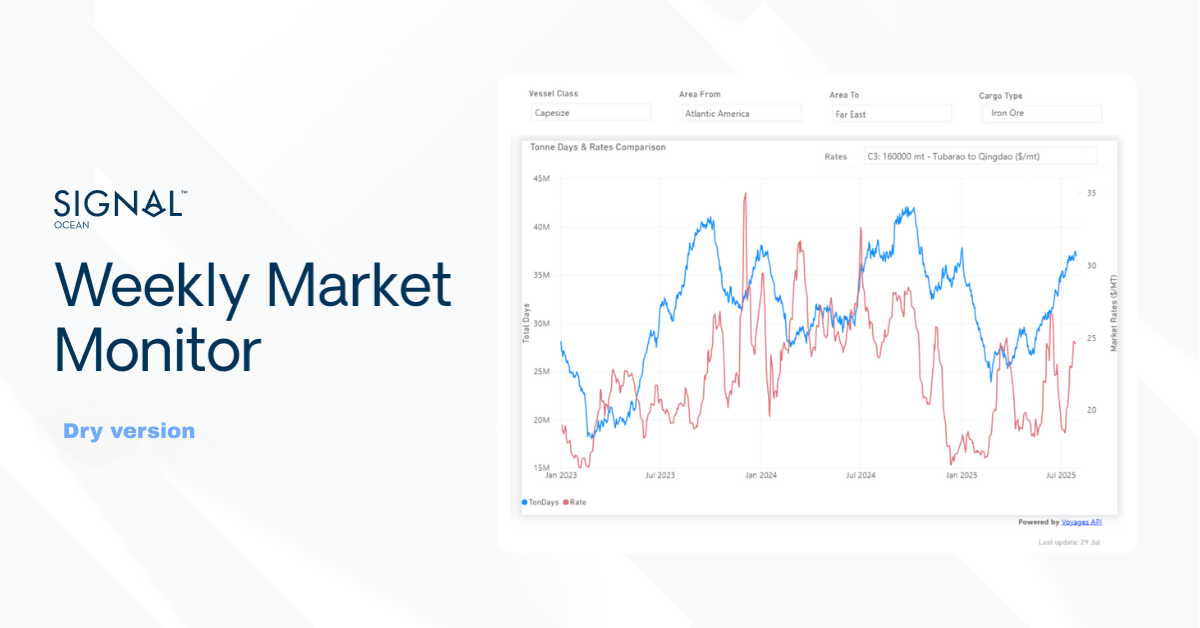
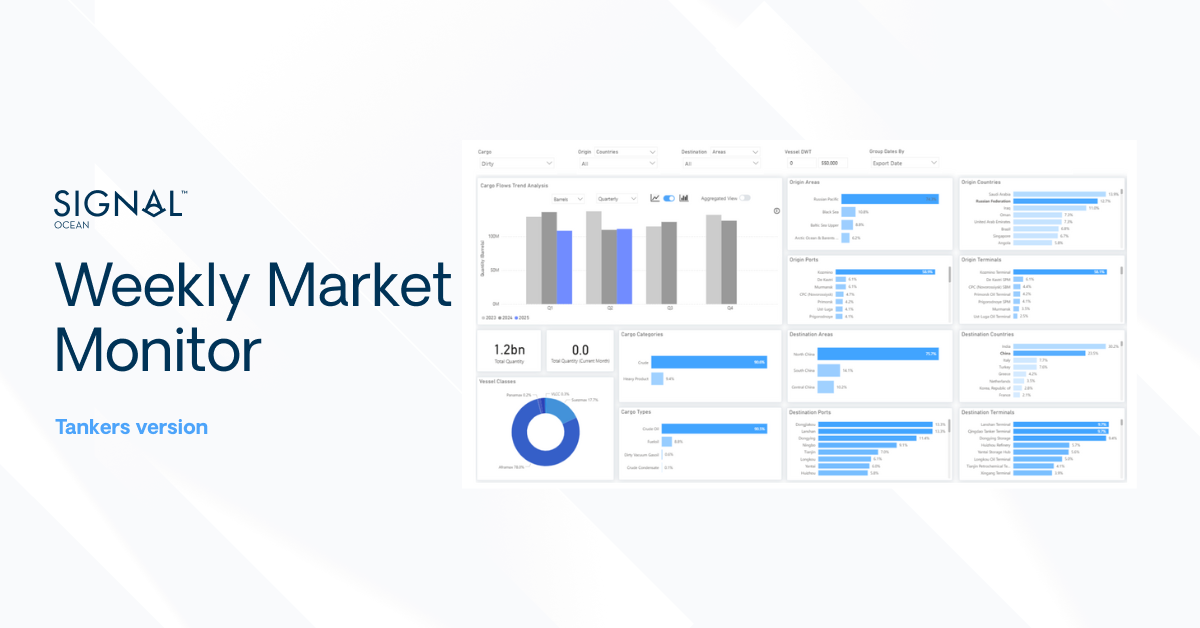
Image 3: Ballasters View Capesize Vs Baltic Rates, 2022-2024
Image 3 presents a comprehensive view of the correlation between the vessel count of Capesize Ballasters and the performance of C3 rates ($/mt). Notably, the surge in the number of ballast vessels exceeding 250 in mid-February coincided with a downturn in C3 rates, dipping below the $25/ton mark.
However, the recent decline in the number of ballast vessels to below 200 has sparked optimism for a stronger momentum in C3 rates. Should this trend persist and the daily average of ballast vessels remain below the 200 mark towards the end of the month, it could potentially propel C3 rates towards the $30/ton threshold. This suggests a potential shift in market dynamics, with favourable implications for rate performance in the near future.
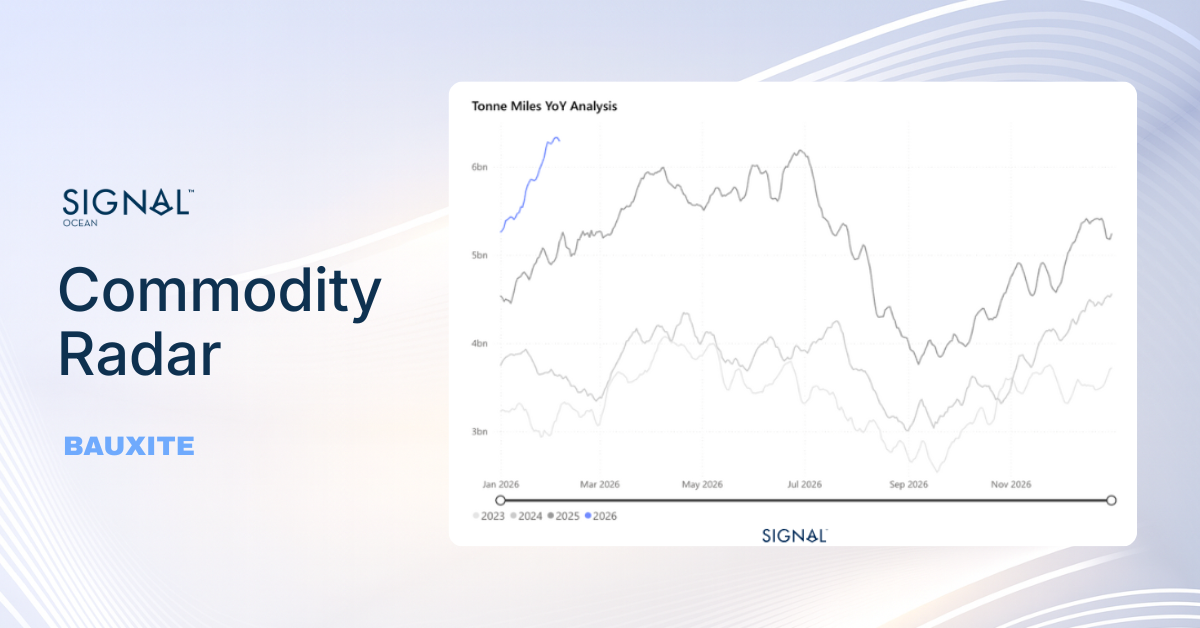
Supply Demand Scenarios for C3 breakeven point
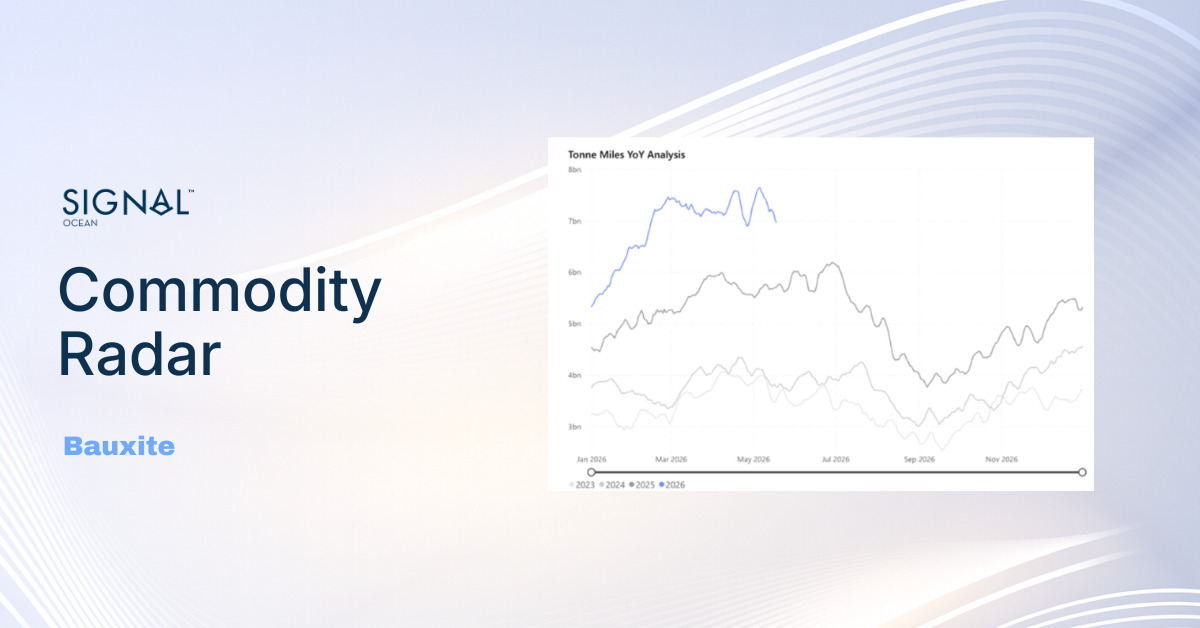
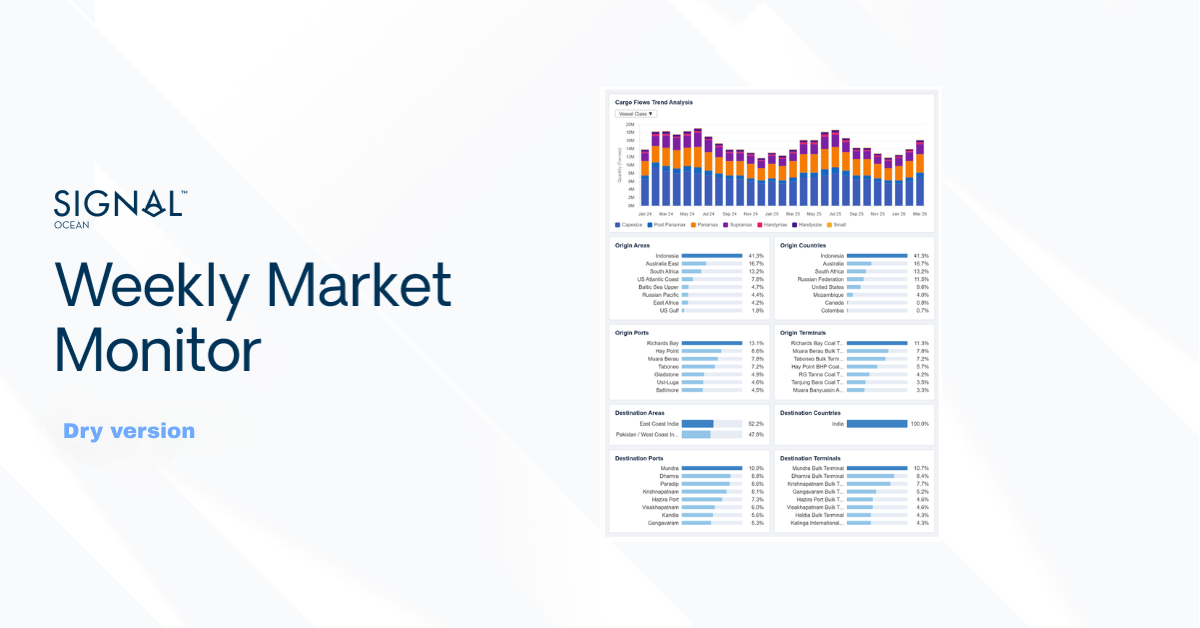
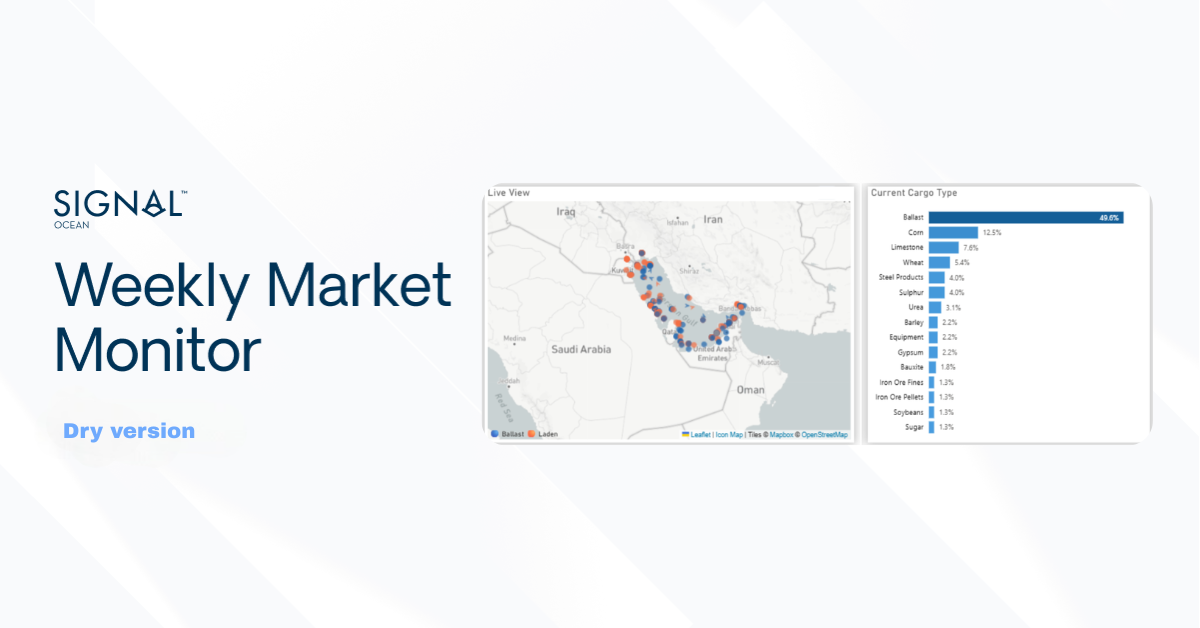
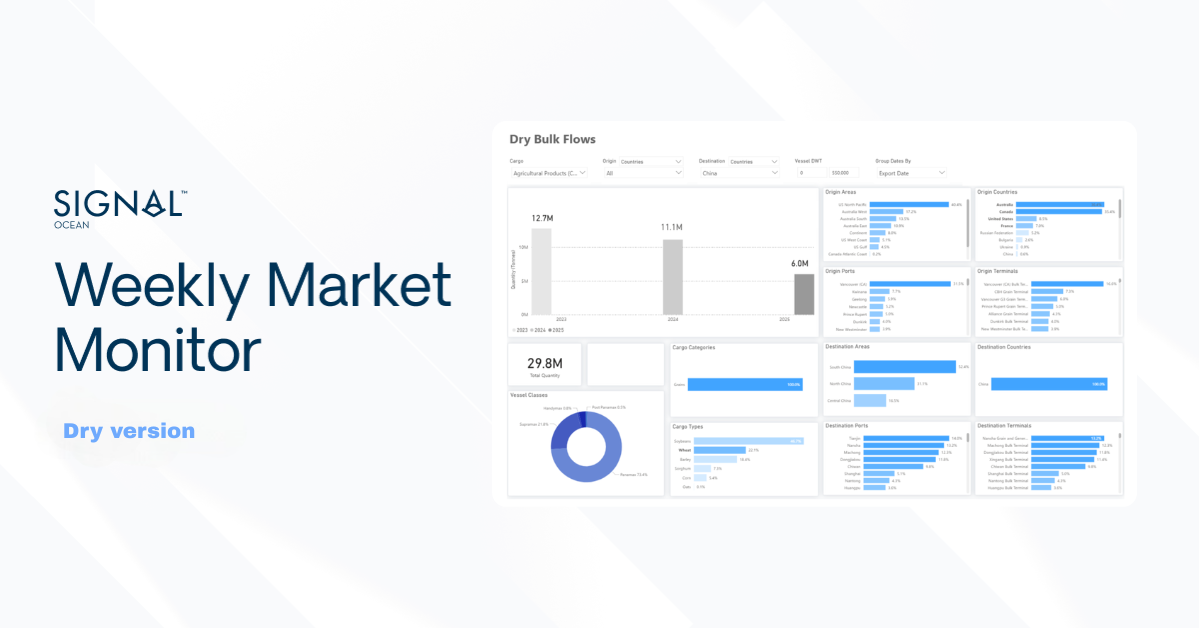
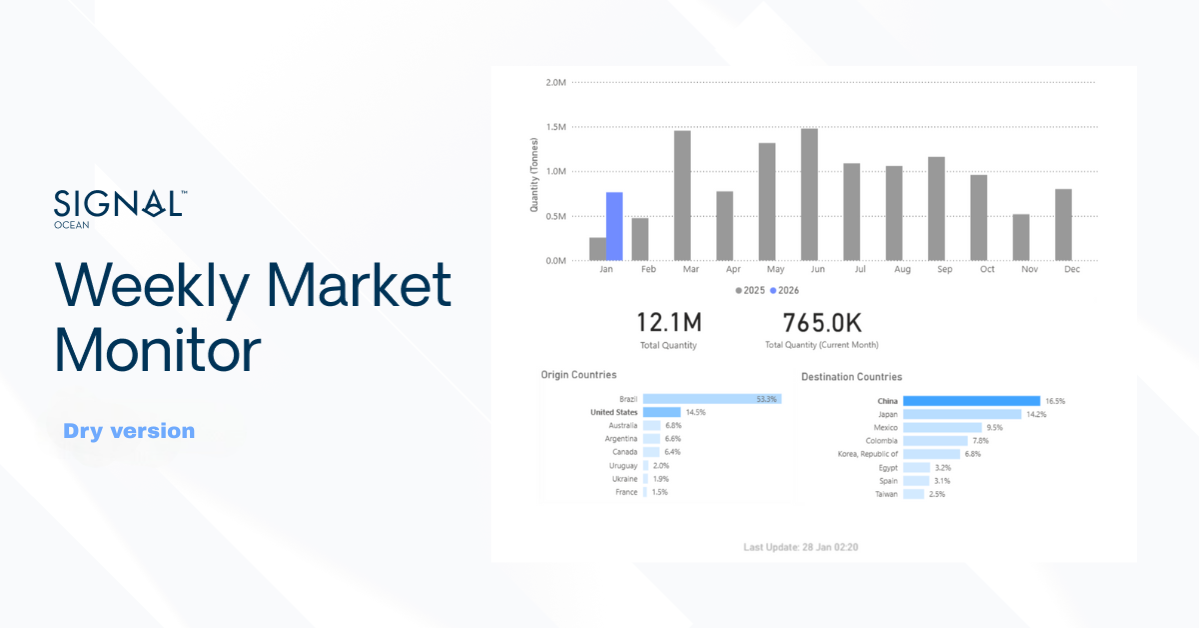
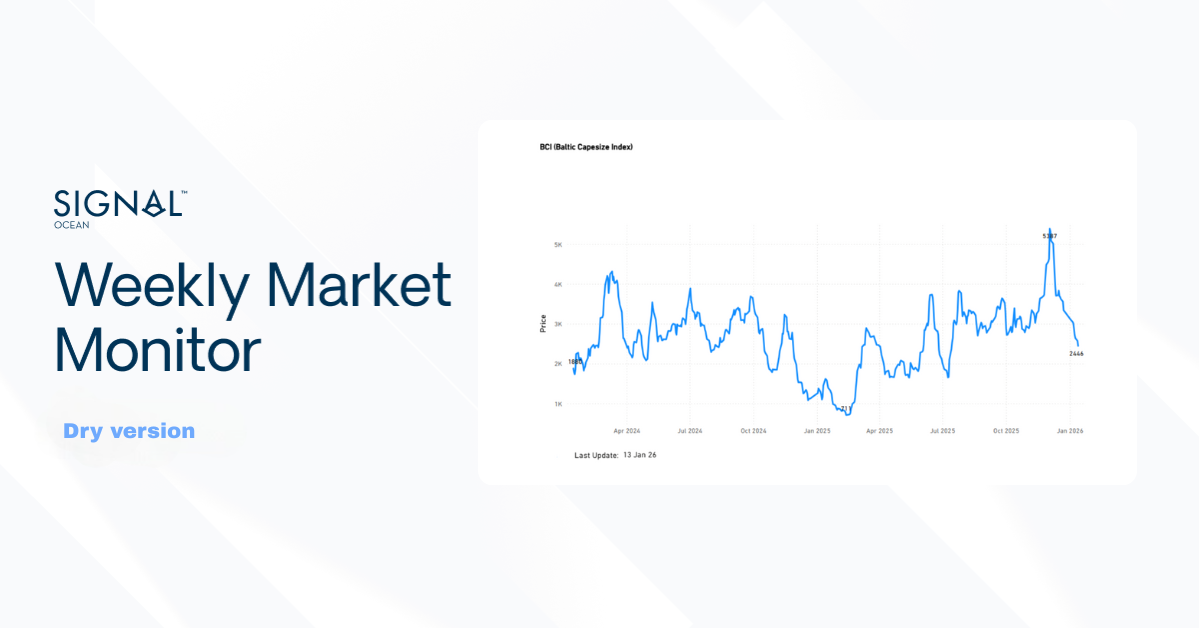
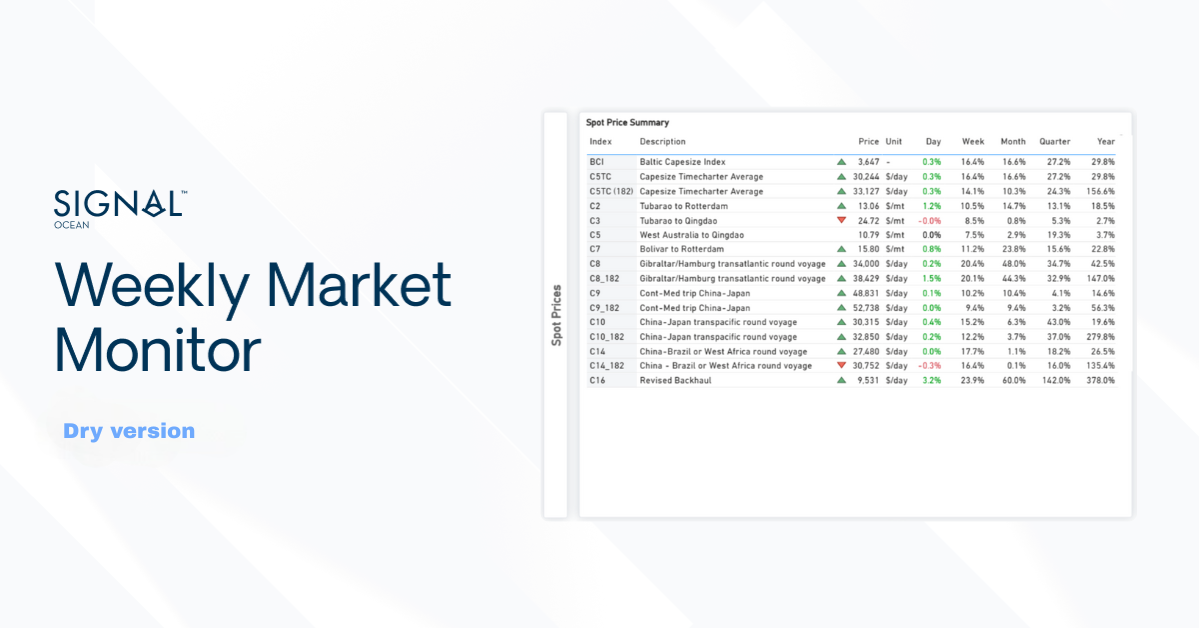
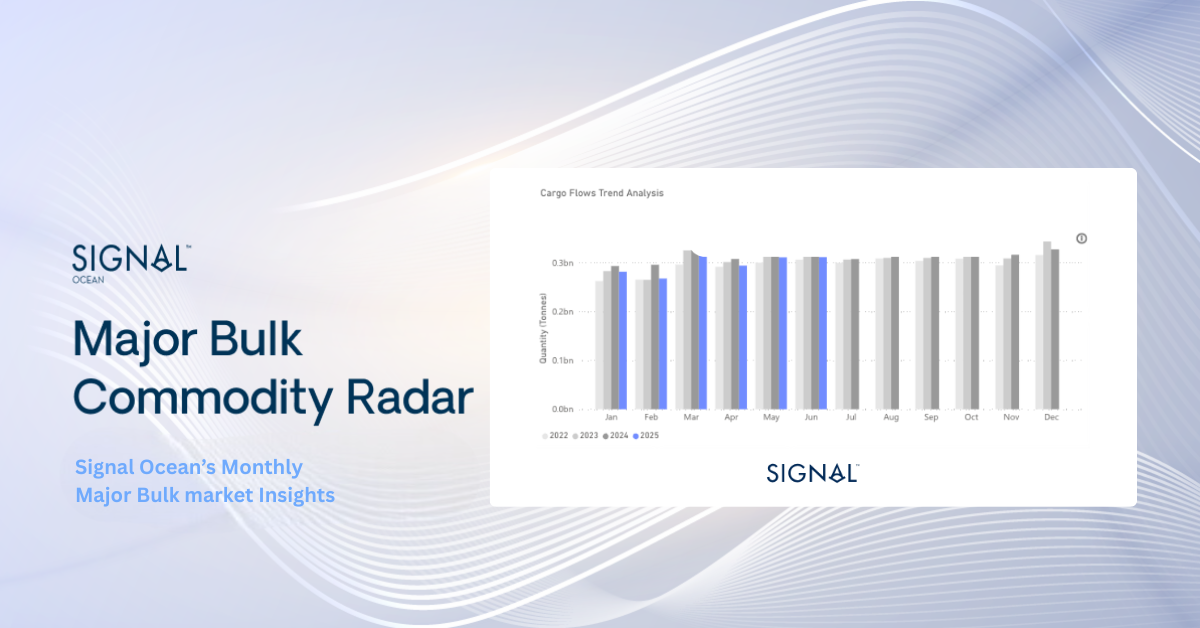
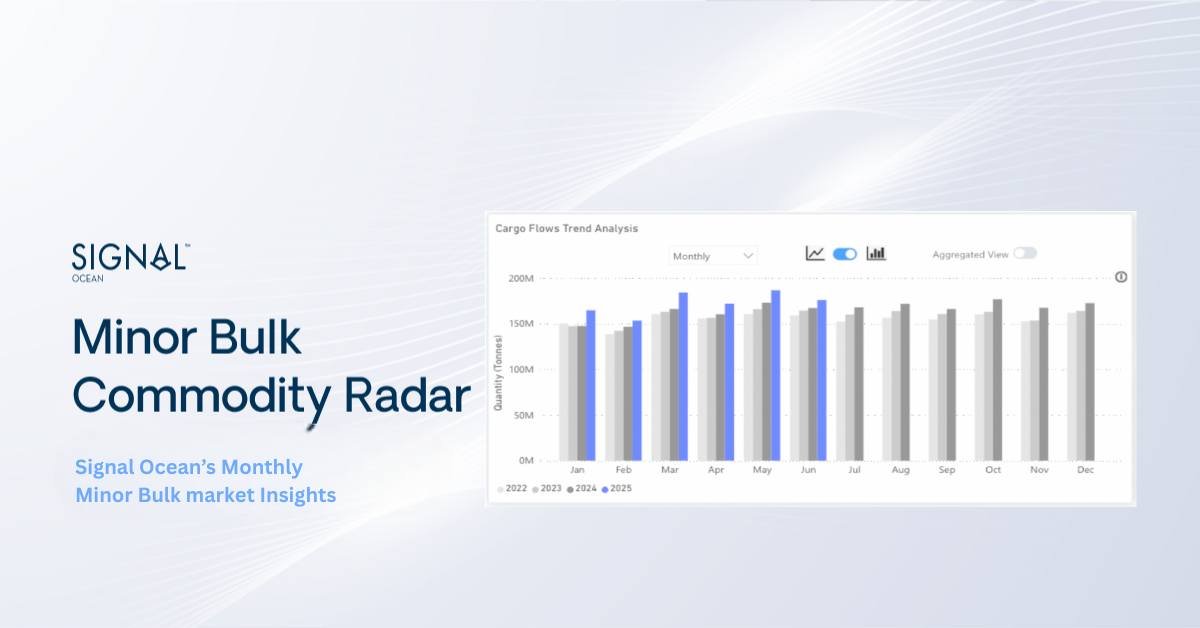
Image 4: Supply - Demand Scenarios (10-40 days forward)
Expanding on the features of the Signal Ocean Platform Market Insights
Within the Signal Ocean Platform Market Insights, users gain access to invaluable scenarios depicting the delicate balance between supply and demand within the freight market. This tool allows for real-time monitoring of critical breakeven points, where supply and demand imbalances are reconciled, ultimately influencing the direction of freight rates.
In the image provided, a pivotal breakeven point is highlighted, projected at 20 days forward. Here, the demand benchmark reaches 20 million units, intersecting with the supply curve. This convergence triggers a notable downward pressure on rates, indicative of a potentially aggressive trend shift.
Specifically, the next 14 day average based on 2023 historical numbers for the daily volume loaded in the South Atlantic currently hovers above the demand benchmark of 1 million tons. However, it remains below the prevailing supply trend, encompassing vessels in both laden and unladen states.
Stay tuned for our special features, offering detailed insights into Capesize, Panamax, and Supramax vessels. We'll delve into diverse routes, providing comprehensive comparisons of supply-demand scenarios. Uncover the dynamic trends and trajectories of freight routes as we navigate through the intricacies shaping the maritime industry.
Maria holds a M.Sc. in Shipping, Trade and Finance from the Bayes Business School at the City University in London and a B.Sc. in Shipping Economics from the University of Piraeus.
Creating a sustainable world requires us to embark on a journey towards a zero emission future, where every step is a commitment to preserve our planet for future generations.
Albert Greenway
Environmental Scientist, Sustainability Expert
No items found.
Increased Use of Renewable Energy:
Shipping companies are embracing renewable energy sources to power onboard systems and reduce emissions during port operations. Solar panels and wind turbines are being installed on vessels to generate clean energy, reducing reliance on auxiliary engines, and cutting down emissions. Shore power facilities in ports allow ships to connect to the electrical grid, eliminating the need for onboard generators while docked.
Collaboration and Industry Partnerships:
Recognizing that addressing emissions requires collective action, shipping companies, governments, and organizations have formed partnerships and collaborations. These initiatives focus on research and development, sharing best practices, and promoting knowledge transfer. Joint projects aim to develop and deploy innovative technologies, improve infrastructure, and create a supportive regulatory framework to accelerate the industry's transition towards a greener future. The Zero Emission Shipping - Mission Innovation.
To pave the way for a greener future in shipping, the availability of alternative fuels plays a vital role in their widespread adoption. However, this availability is influenced by factors such as port infrastructure, local regulations, and government policies. As the demand for cleaner fuels in shipping rises and environmental regulations become more stringent, efforts are underway to improve the accessibility of these fuels through infrastructure development, collaborations, and investments in production facilities.
Liquefied Natural Gas (LNG) infrastructure has seen significant growth in recent years, resulting in more LNG bunkering facilities and LNG-powered vessels. Nonetheless, the availability of LNG as a marine fuel can still vary depending on the region. To ensure consistent availability worldwide, there is a need for further development of LNG supply chains and infrastructure. For biofuels, their availability hinges on production capacity and the availability of feedstock. Although biofuels are being produced and utilized in various sectors, their availability as a marine fuel remains limited. Scaling up biofuel production and establishing robust supply chains are imperative to ensure wider availability within the shipping industry.Hydrogen, as a fuel for maritime applications, is still in the early stages of infrastructure development. While some hydrogen vessels have been tested or introduced in the first quarter of last year, the infrastructure required for hydrogen production and distribution needs further advancement.
Ammonia, as a marine fuel, currently faces limitations in availability. The production, storage, and handling infrastructure for ammonia need further development to support its widespread use in the shipping industry.Methanol, on the other hand, is already a commercially available fuel and has been used as a blend with conventional fuels in some ships. However, its availability as a standalone marine fuel can still be limited in certain regions. Bureau Veritas in October 2022 published a White Paper for the Alternative Fuels Outlook. This white paper provides a comprehensive overview of alternative fuels for the shipping industry, taking into account key factors such as technological maturity, availability, safety, emissions, and regulations.
Creating a sustainable world requires us to embark on a journey towards a zero emission future, where every step is a commitment to preserve our planet for future generations.
Albert Greenway
Environmental Scientist, Sustainability Expert
Increased Use of Renewable Energy:
Shipping companies are embracing renewable energy sources to power onboard systems and reduce emissions during port operations. Solar panels and wind turbines are being installed on vessels to generate clean energy, reducing reliance on auxiliary engines, and cutting down emissions. Shore power facilities in ports allow ships to connect to the electrical grid, eliminating the need for onboard generators while docked.
Collaboration and Industry Partnerships:
Recognizing that addressing emissions requires collective action, shipping companies, governments, and organizations have formed partnerships and collaborations. These initiatives focus on research and development, sharing best practices, and promoting knowledge transfer. Joint projects aim to develop and deploy innovative technologies, improve infrastructure, and create a supportive regulatory framework to accelerate the industry's transition towards a greener future. The Zero Emission Shipping - Mission Innovation.
To pave the way for a greener future in shipping, the availability of alternative fuels plays a vital role in their widespread adoption. However, this availability is influenced by factors such as port infrastructure, local regulations, and government policies. As the demand for cleaner fuels in shipping rises and environmental regulations become more stringent, efforts are underway to improve the accessibility of these fuels through infrastructure development, collaborations, and investments in production facilities.
Liquefied Natural Gas (LNG) infrastructure has seen significant growth in recent years, resulting in more LNG bunkering facilities and LNG-powered vessels. Nonetheless, the availability of LNG as a marine fuel can still vary depending on the region. To ensure consistent availability worldwide, there is a need for further development of LNG supply chains and infrastructure. For biofuels, their availability hinges on production capacity and the availability of feedstock. Although biofuels are being produced and utilized in various sectors, their availability as a marine fuel remains limited. Scaling up biofuel production and establishing robust supply chains are imperative to ensure wider availability within the shipping industry.Hydrogen, as a fuel for maritime applications, is still in the early stages of infrastructure development. While some hydrogen vessels have been tested or introduced in the first quarter of last year, the infrastructure required for hydrogen production and distribution needs further advancement.
Ammonia, as a marine fuel, currently faces limitations in availability. The production, storage, and handling infrastructure for ammonia need further development to support its widespread use in the shipping industry.Methanol, on the other hand, is already a commercially available fuel and has been used as a blend with conventional fuels in some ships. However, its availability as a standalone marine fuel can still be limited in certain regions. Bureau Veritas in October 2022 published a White Paper for the Alternative Fuels Outlook. This white paper provides a comprehensive overview of alternative fuels for the shipping industry, taking into account key factors such as technological maturity, availability, safety, emissions, and regulations.


.png)


.png)
.png)


.png)
.png)
.png)

.png)
.png)
.png)
.png)
.png)
.png)
.png)
.png)
.png)
.png)
.png)
.png)


.avif)
.avif)
.avif)
.avif)
.avif)
.avif)
.avif)


.avif)
.avif)