Subscribe for our latest news, straight to your inbox:
Thank you! Your submission has been received!
Oops! Something went wrong while submitting the form.
Share this post
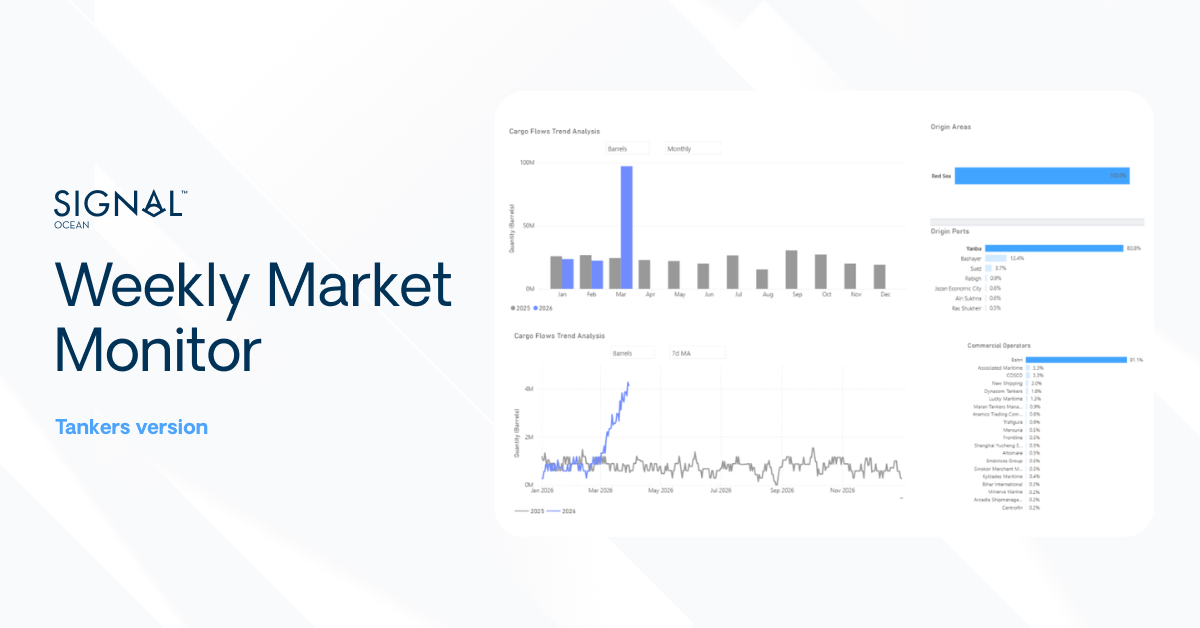
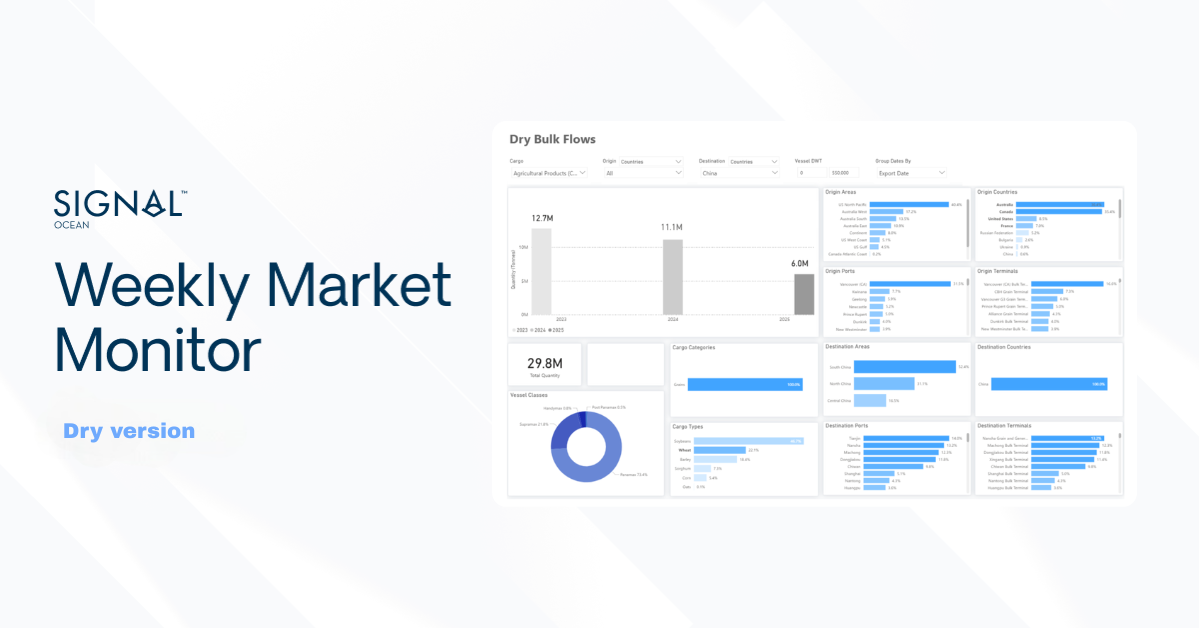
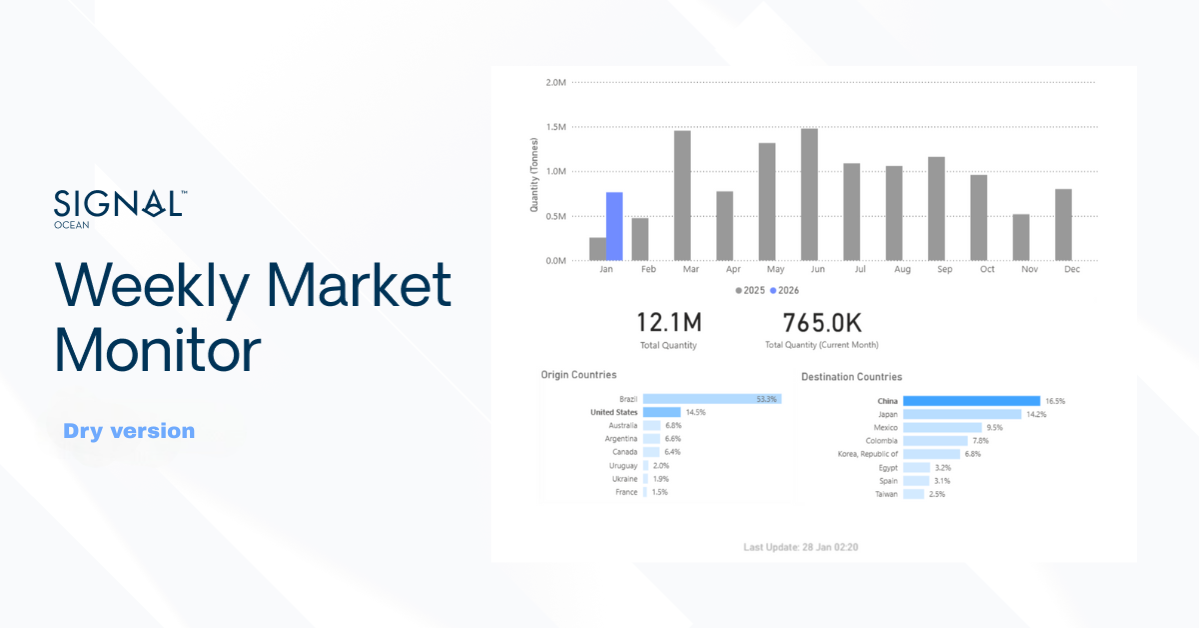
U.S. Overtakes Brazil in Corn Exports to China Ahead of End-Q1 2026
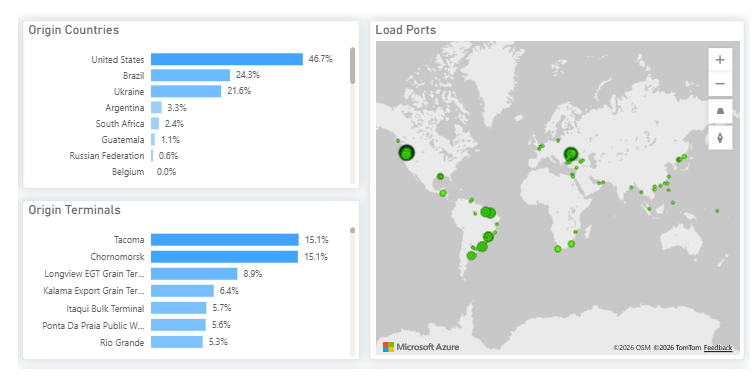
Source: Signal Ocean Platform | Dry Flows Data (last update: March 18, 2026)
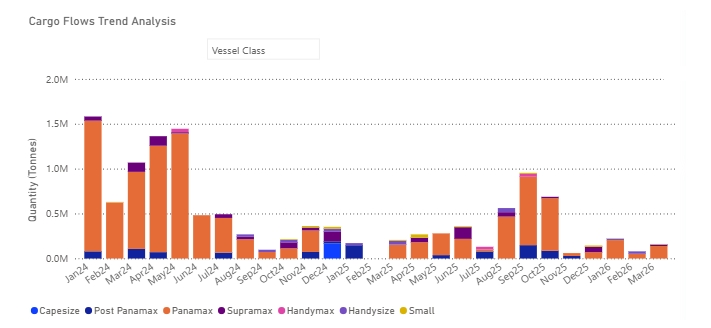
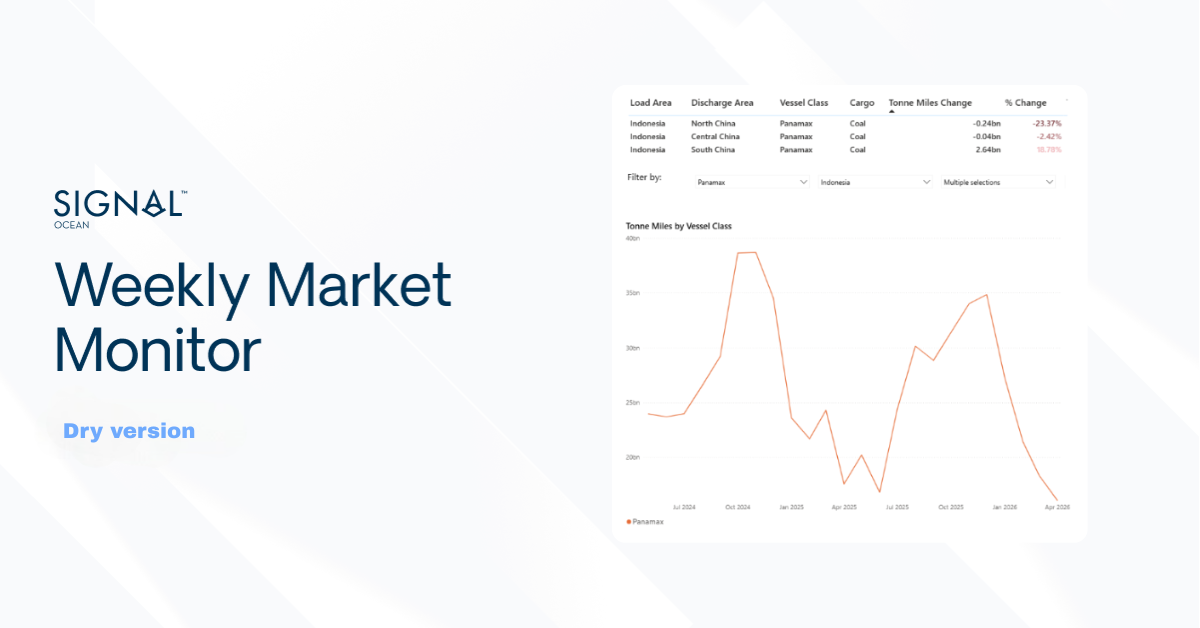
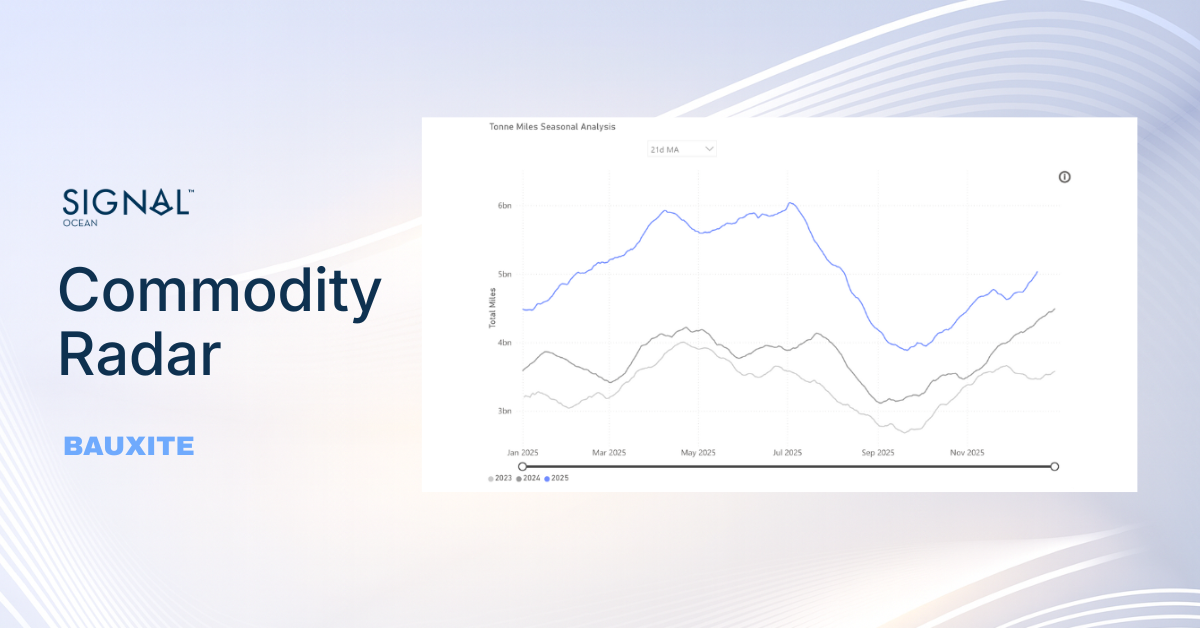
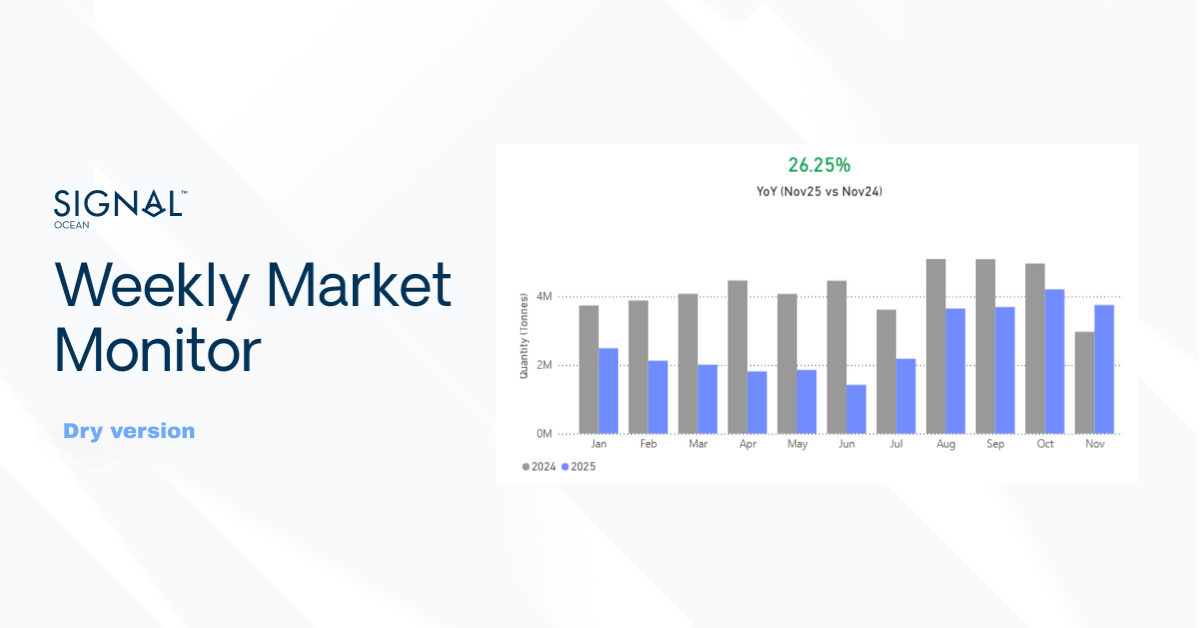
Breakdown of Corn Flows to China by Vessel Class Panamax accounts for approximately 80% of total volumes
Source: Signal Ocean Platform | Dry Flows Data (last update: March 18, 2026)
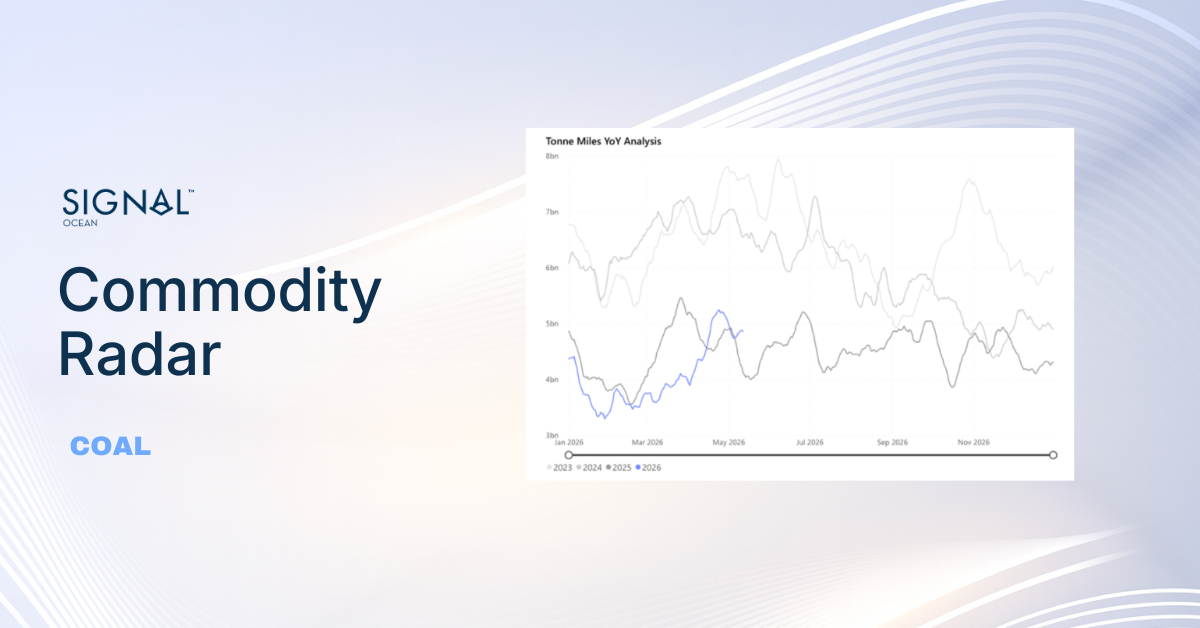
Chinese corn imports declined to approximately 3.8M mt in 2025, down from 8.4M mt in 2024. Of this, around 2.5M mt originated from Brazil (Panamax: ~2.0M mt vs. 1.78M mt in 2024), while imports from the U.S. totaled 169k mt (Panamax: ~153k mt vs. 1.36M mt in 2024). This contraction aligns with China’s policy direction over the past three years. The focus has been on increasing domestic self-sufficiency. As such, the recent decline in imports is not primarily driven by trade tensions, but rather reflects a policy-driven agricultural transformation underway in Beijing.
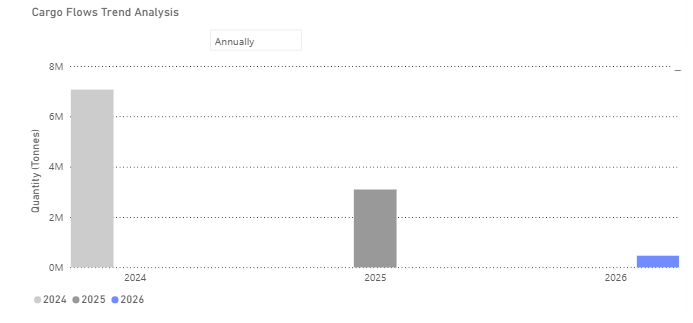
Source: Signal Ocean Platform | Dry Flows Data (last update: March 18, 2026)
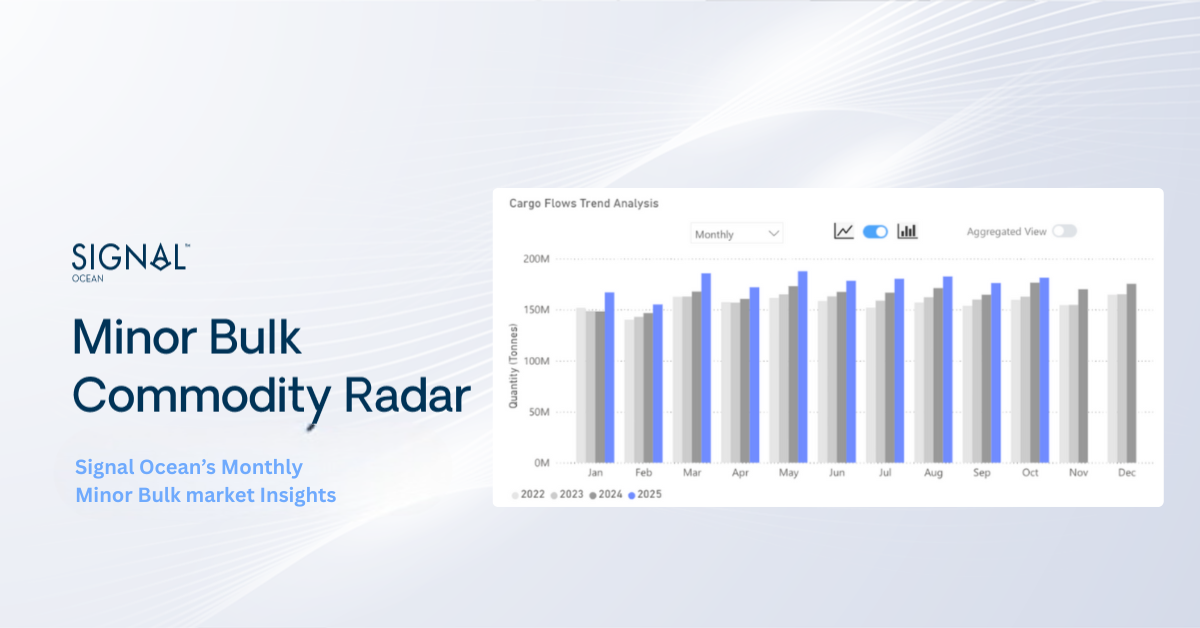
With imports declining and domestic output rising, China’s evolving grain policy is expected to have far-reaching implications for major exporters, including Brazil, the U.S., and Ukraine. Looking ahead, China is likely to continue prioritizing internal efficiency, requiring global corn exporters to adapt to a lower level of Chinese import demand.
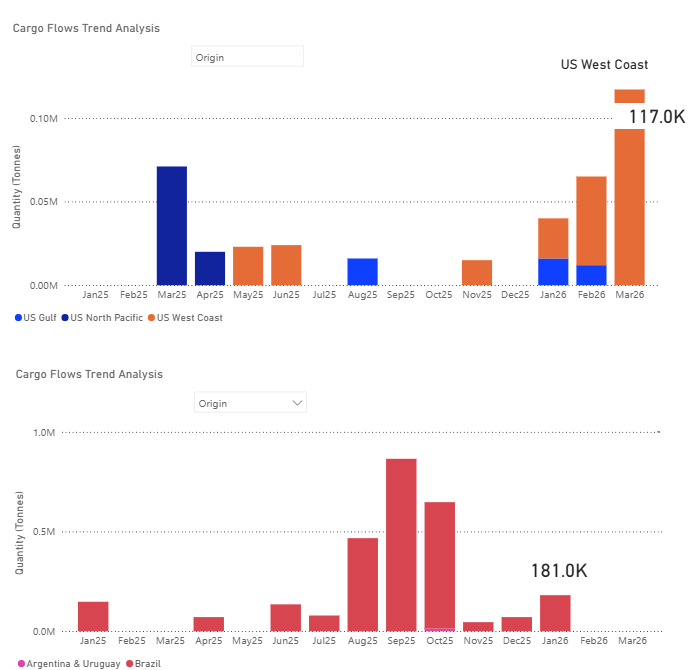
While Brazil was the primary supplier of corn to China in 2025, early Q1 2026 data show the U.S. has regained market share and moved ahead by late March.
Source: Signal Ocean Platform | Dry Flows Data (last update: March 18, 2026)
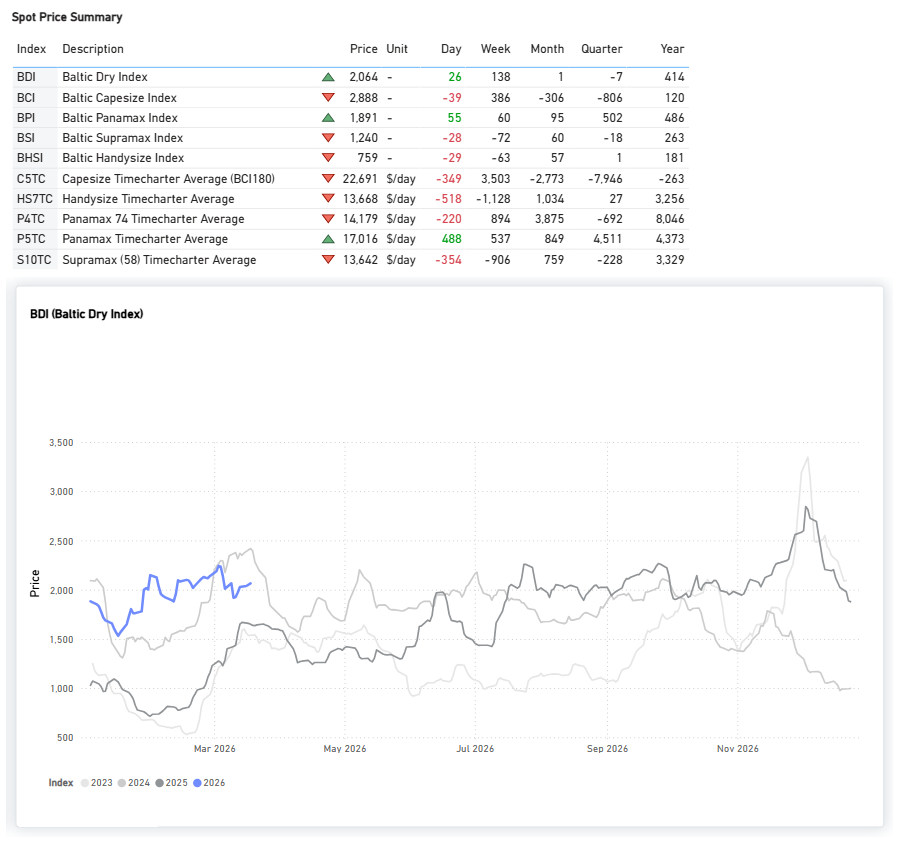
FREIGHT MARKET OVERVIEW
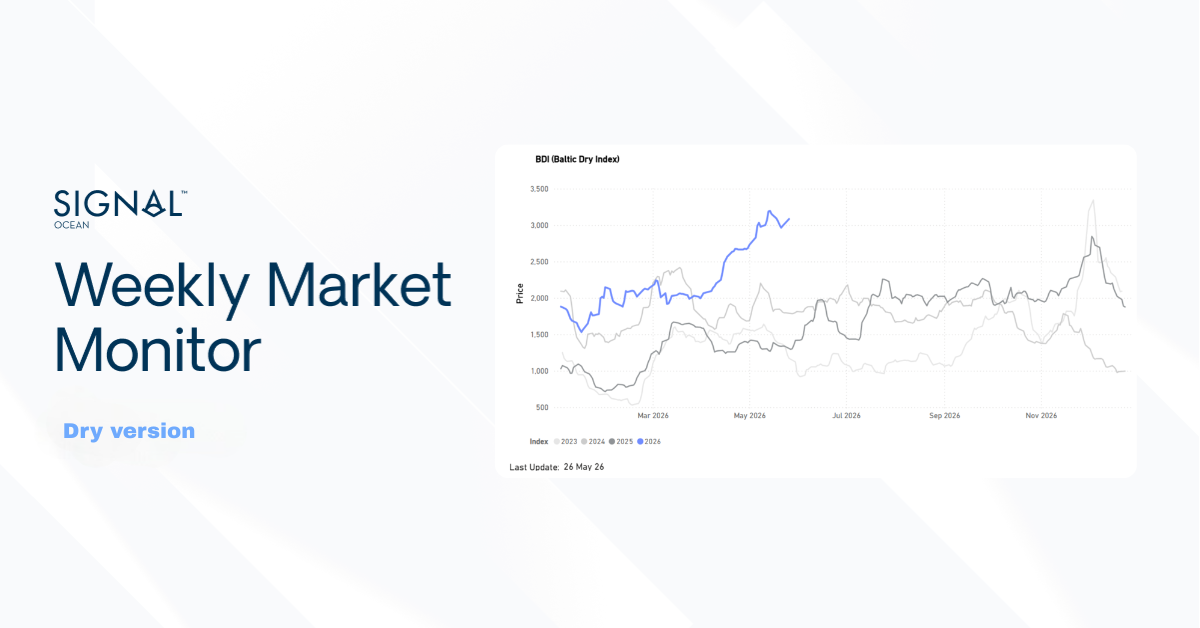
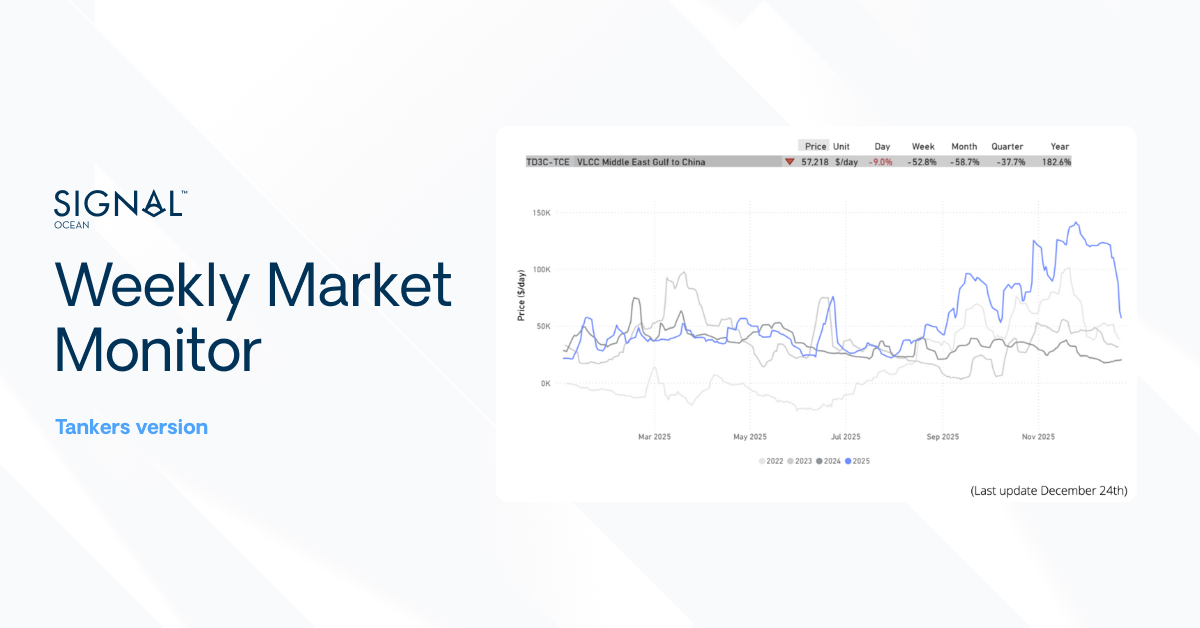
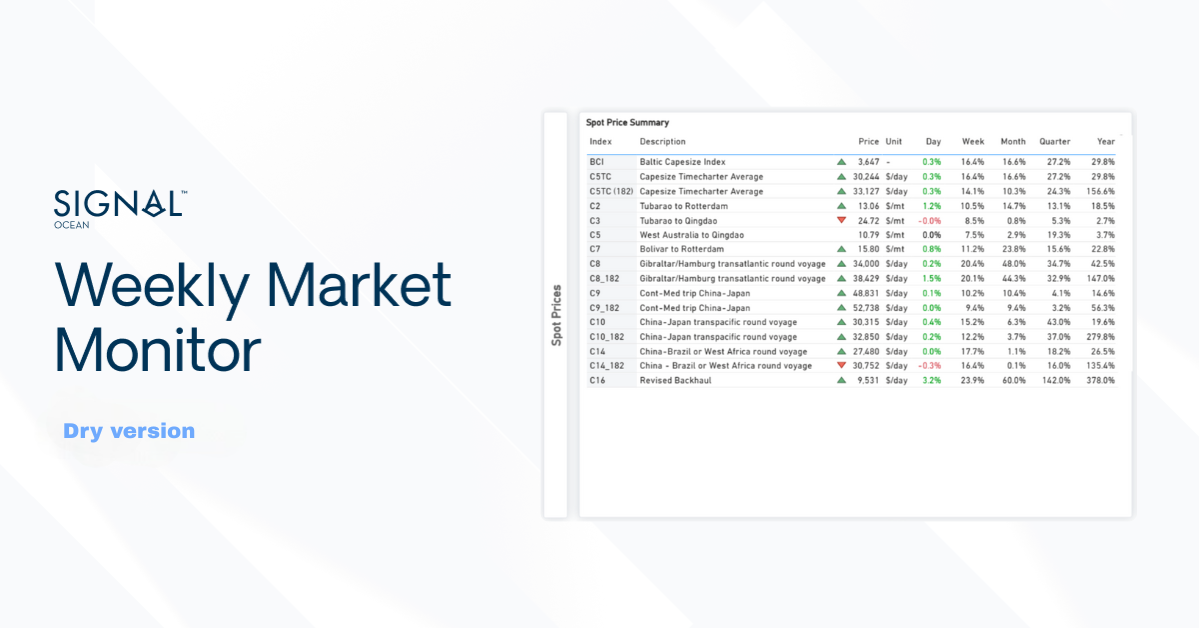
The Baltic Dry Index (BDI) recorded an uptick in sentiment before the end of the week, with the index value moving above the 2,000-point mark, driven by weekly gains in the Capesize and Panamax segments.
FREIGHT ATLANTIC
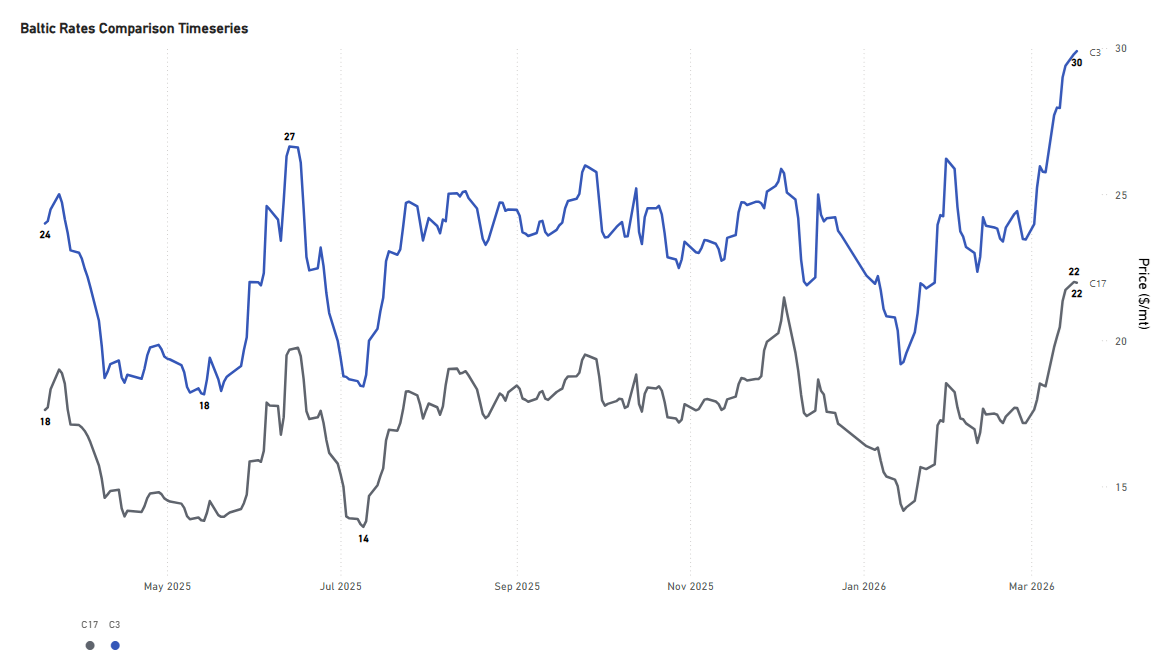
Capesize | Firmer
C3 Tubarao–Qingdao / C17 Saldanha Bay–Qingdao
The rate for the Tubarao to Qingdao route held the firmer sentiment of the previous week, with rates still around $30/mt (+23% YoY). Similarly, the Saldanha Bay-Qingdao rates were assessed at around $22/mt (+24% YoY).
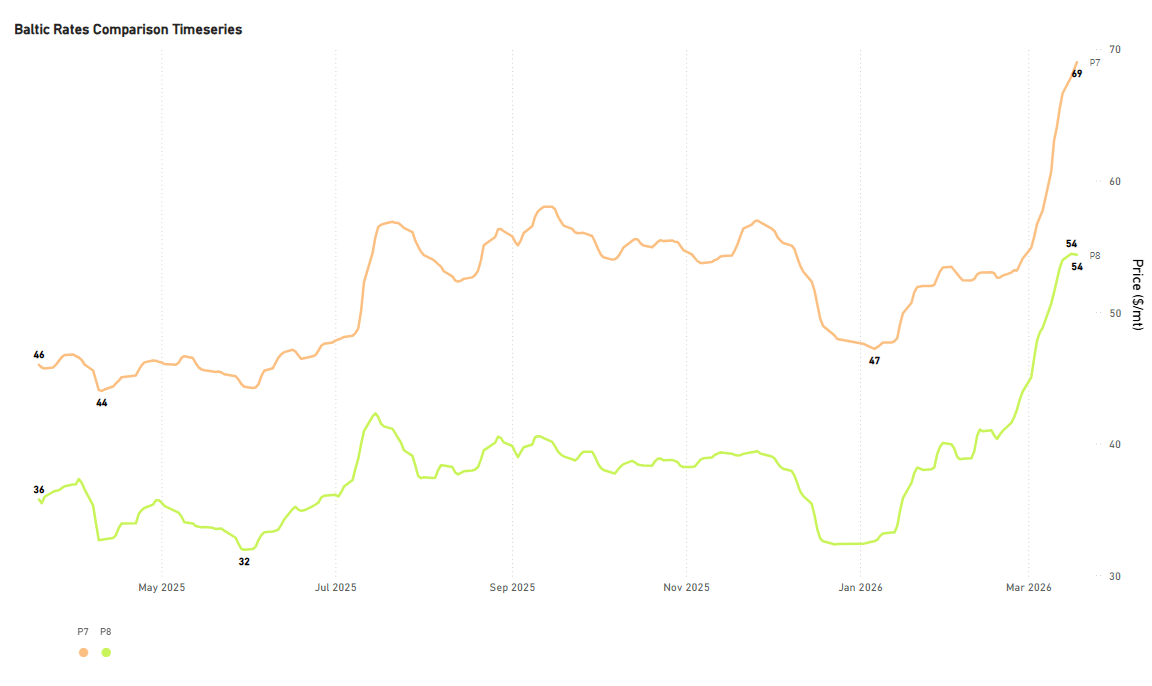
Rates for the USG–Qingdao and Santos–Qingdao routes are reaching exceptional highs. The Santos–Qingdao rate was assessed at $54/mt (+50% YoY). Notably, the USG–Qingdao rate strengthened further to around $70/mt, approximately $10/mt higher than the previous week (+49% YoY).
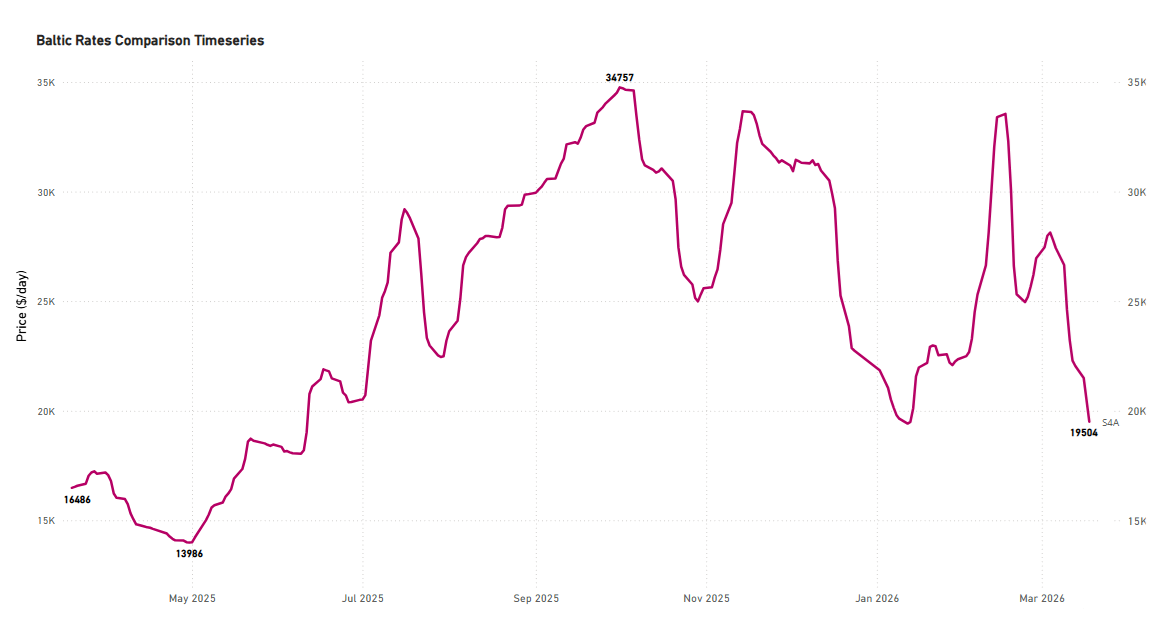
SUPRAMAX | Weaker
S4A US Gulf trip to Skaw-Passero
Rates on the USG-to-Skaw–Passero route continued to decline, as highlighted in our previous Dry Market Monitor, and are now around $19k/day, down by $11k/day over the past month.
HANDYSIZE | Weaker
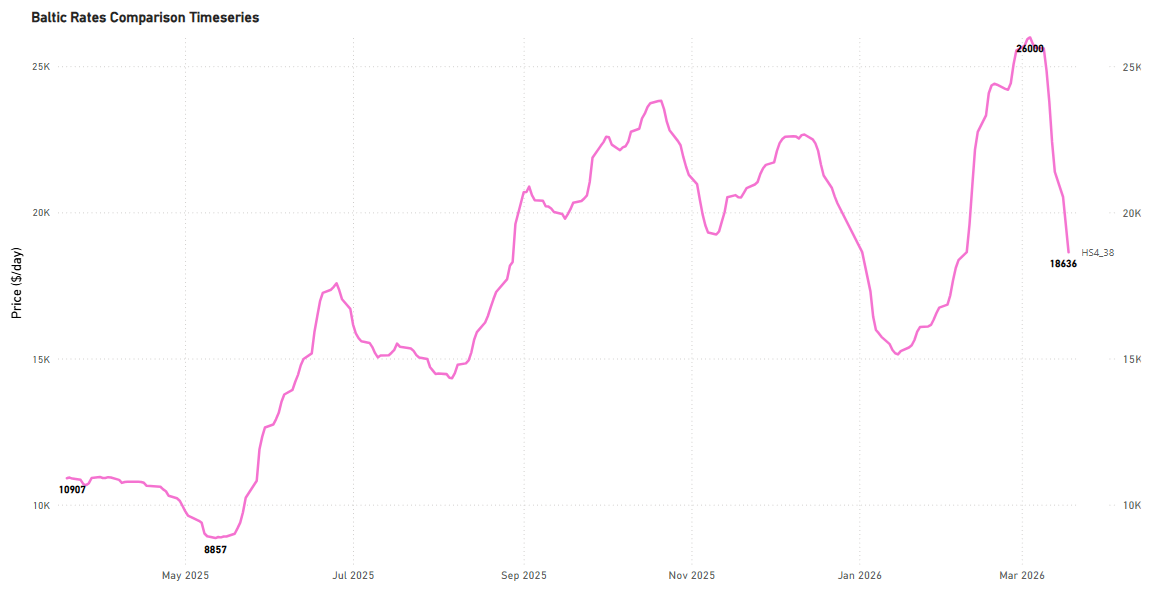
HS4_38 - US Gulf trip via US Gulf or north coast of South America to Skaw-Passero
The USG trip to Skaw–Passero recorded levels of around $18k/day, a decrease of approximately $5k/day from the previous week, which contrasts with the annual rebound of $7.7k/day.
FREIGHT PACIFIC
Capesize | C5 Softer
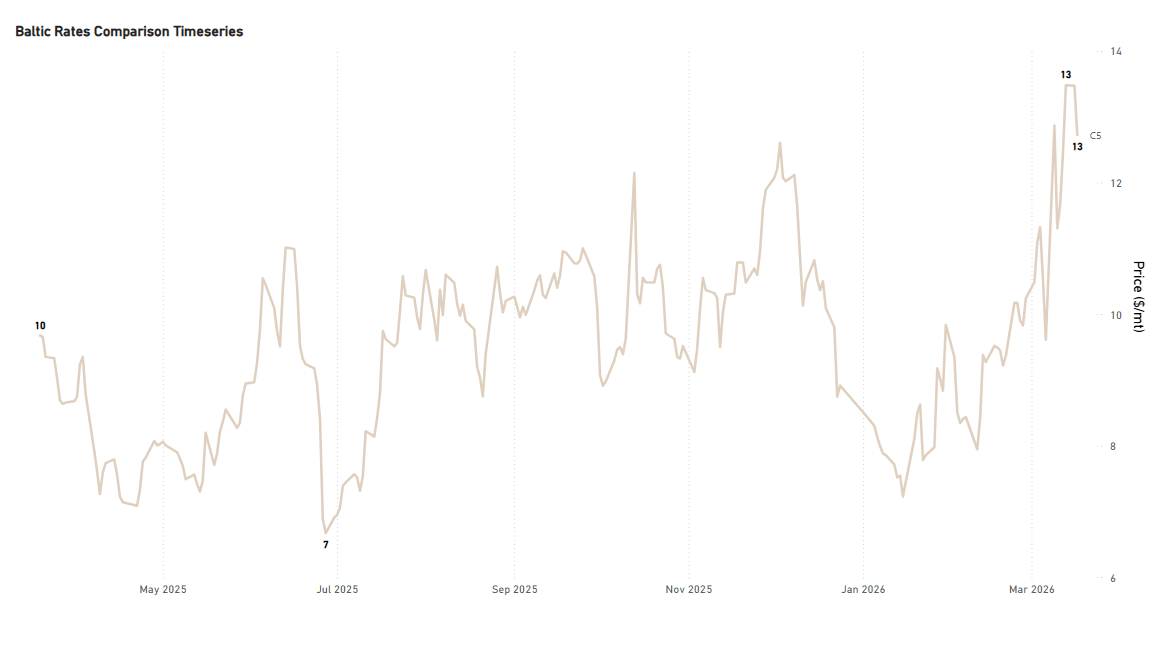
C5 West Australia–Qingdao
Rates on the West Australia–Qingdao route extended their softening trend WoW, at around $13/mt (+27% YoY). Despite the recent easing, levels remain well above the mid-January trough of approximately $7.5/mt.
Panamax | Firmer
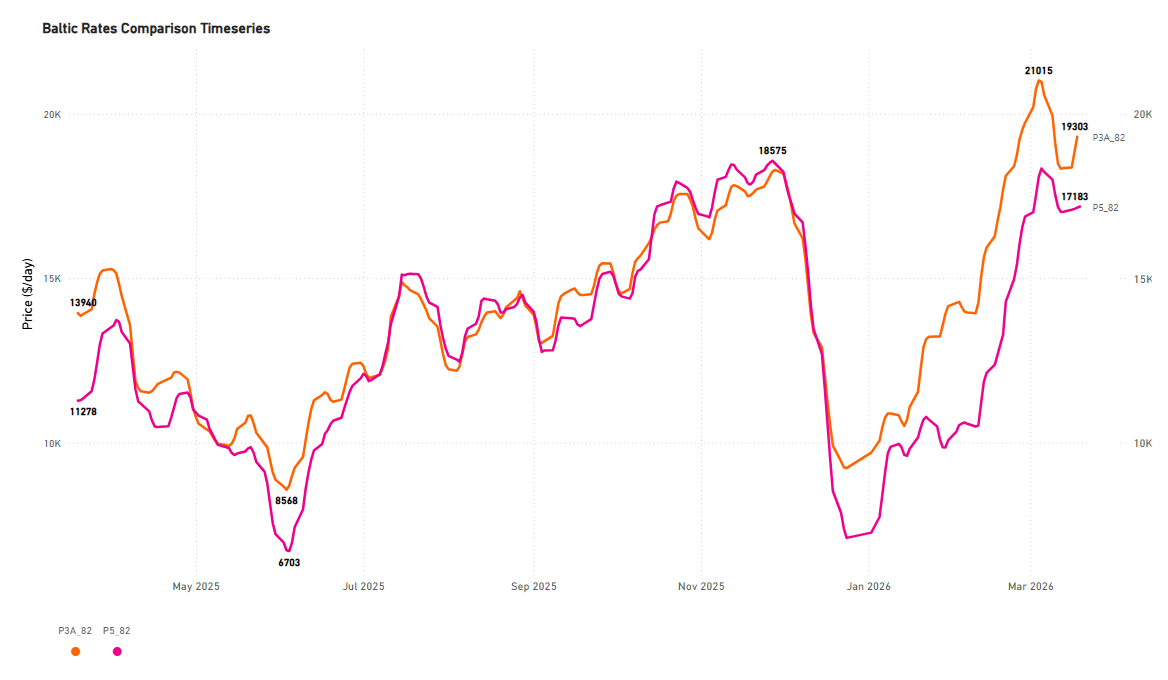
P3A_82 - HK-S Korea incl Taiwan, one Pacific RV
P5_82 - South China, one Indonesian round voyage
The Panamax Pacific market has now reversed the weaker trend recorded in the previous week. Specifically, rates on the P3A_82 route rose to $19k/day, and on the P5_82 route to $17k/day.
SUPRAMAX | Weaker
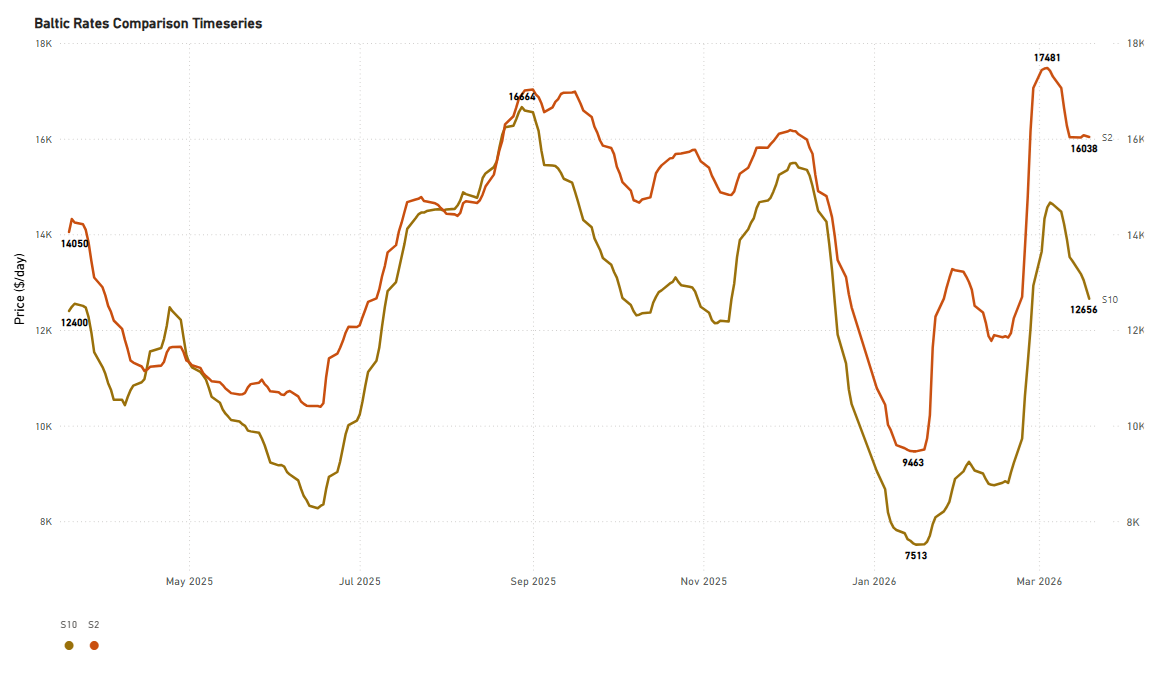
S2 North China one Australian or Pacific round voyage
S10 South China trip via Indonesia to South China
The positive trend in the Supramax Pacific market has reversed to a weaker sentiment. Compared with the previous week, rates for the S10 route have now settled below $13k/day.
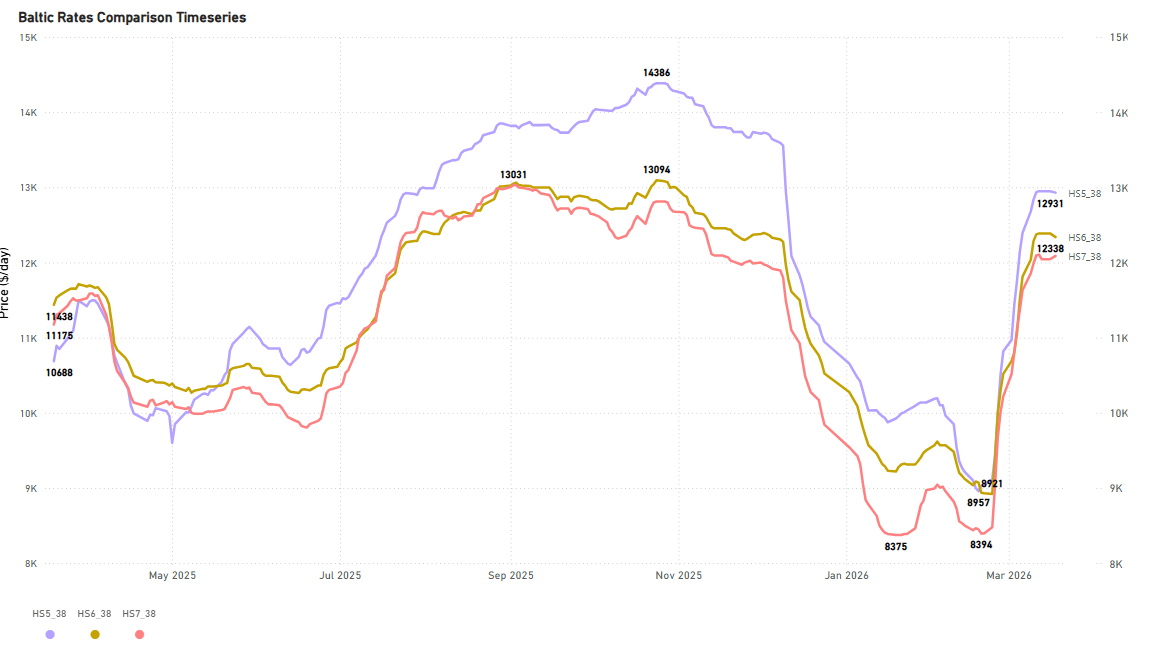
HANDYSIZE | Firmer
HS5_38 - South East Asia trip to Singapore-Japan
HS6_38 - North China-South Korea-Japan trip to North China-South Korea-Japan
HS7_38 - North China-South Korea-Japan trip to Southeast Asia
The Pacific Handysize freight market appears to have reached its highest point since the lows recorded in January and February. Rates for the HS5_38 and HS6_38 routes have strengthened to around $12–13k/day each compared with the previous week, while the HS7_38 rate confirmed the sentiment of the previous week at $12k/day.
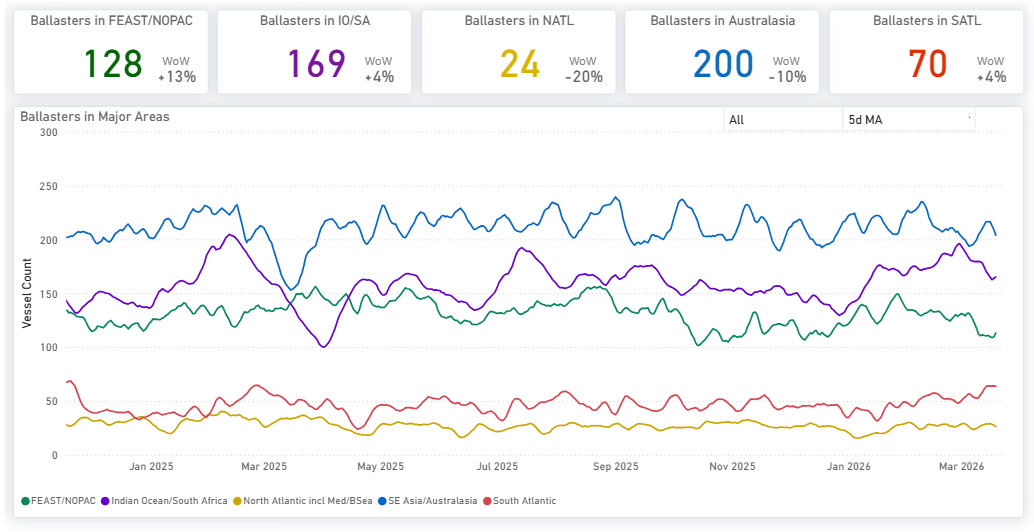
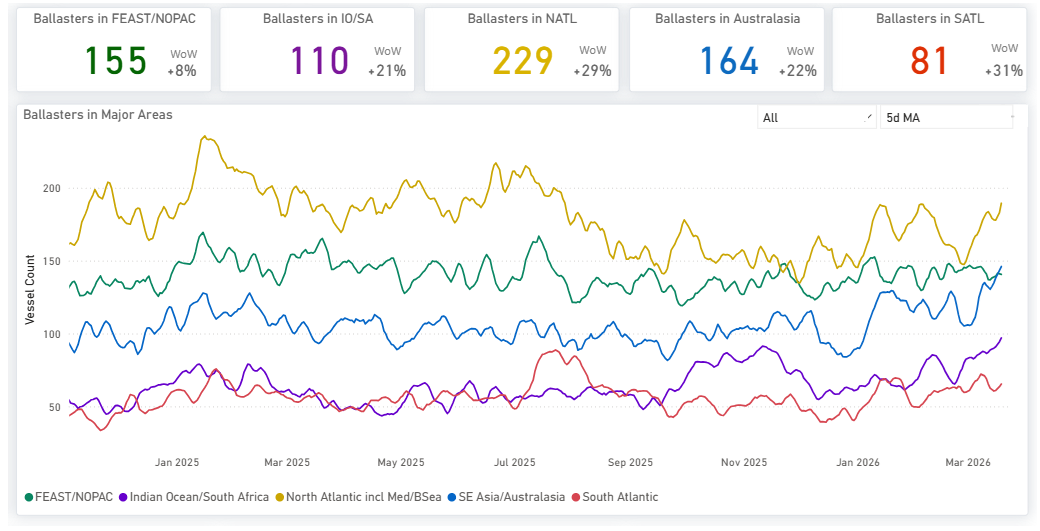
Vessel supply, although still elevated, showed a decrease to 200 vessels in Australasia, compared with last week when the vessel count climbed to over 230 units. In the Atlantic, both the North saw a notable decrease (-20%), while in the South, the vessel count maintained a similar trend to the previous week (~70, 5D MA).
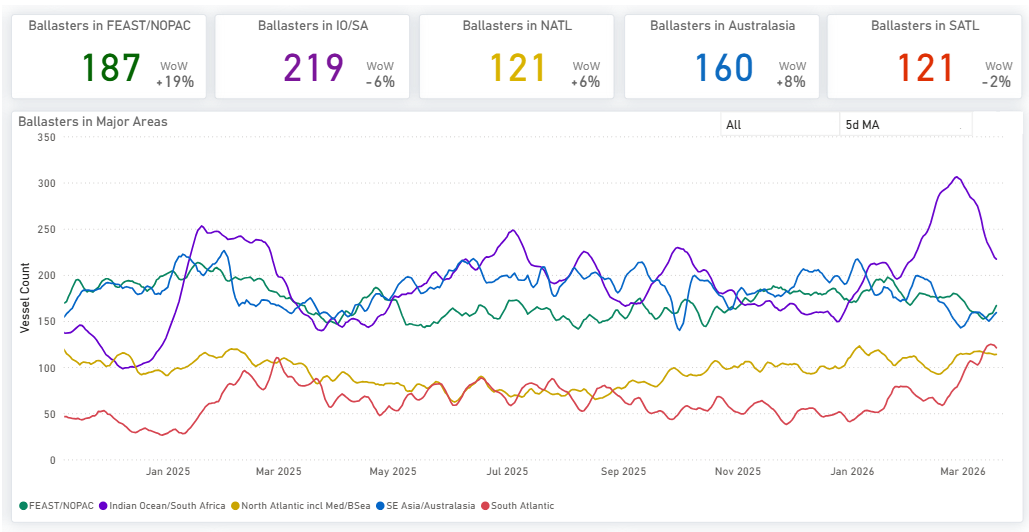
The Indian Ocean experienced a decrease in levels to around 220 after peaking above 300 at the end of February. Meanwhile, in the Far East/NOPAC, following signs of a decline a week ago, levels have started to increase again to nearly 190, whereas early indications in the previous week pointed to a drop below 170. Evidence of increased supply pressure remains in the South, with a vessel count of nearly 120.
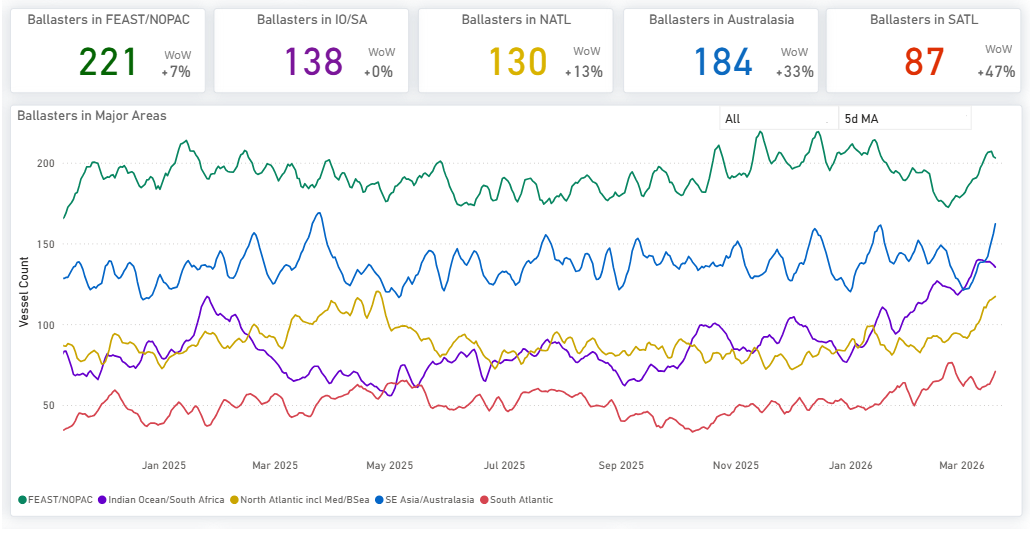
The Pacific region continued to exhibit elevated vessel availability, a trend persisting from the preceding three weeks. The vessel count in the Far East/NOPAC has climbed notably, now standing at 220. Meanwhile, the Atlantic saw a sharp rise in ballasters, particularly in the North Atlantic, where the number held at the elevated level of 130 vessels.
Handysize| 5D MA Increasing
Handysize vessels continued to face elevated supply pressure since the end of February. In the North Atlantic, the vessel count remained high, exceeding 220 and now nearing 230 (+29% WoW). In the Pacific, pressure intensified in Australasia, where the vessel count surpassed 160 (+20% WoW).
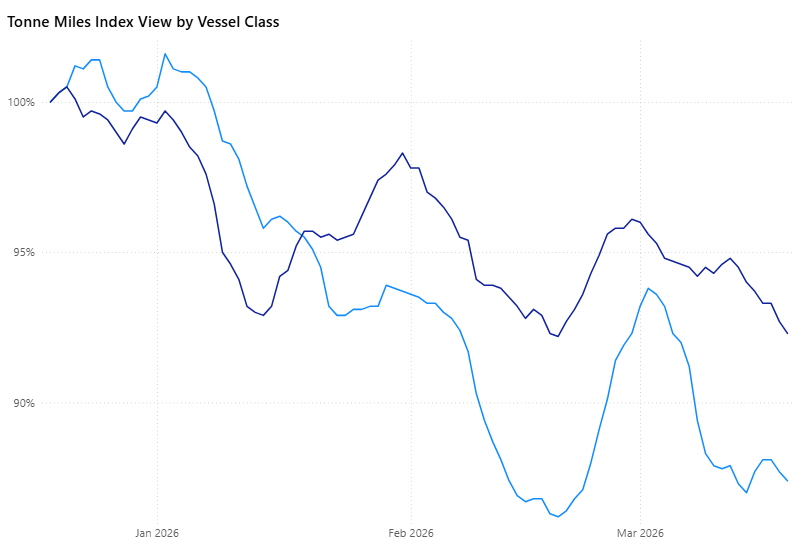
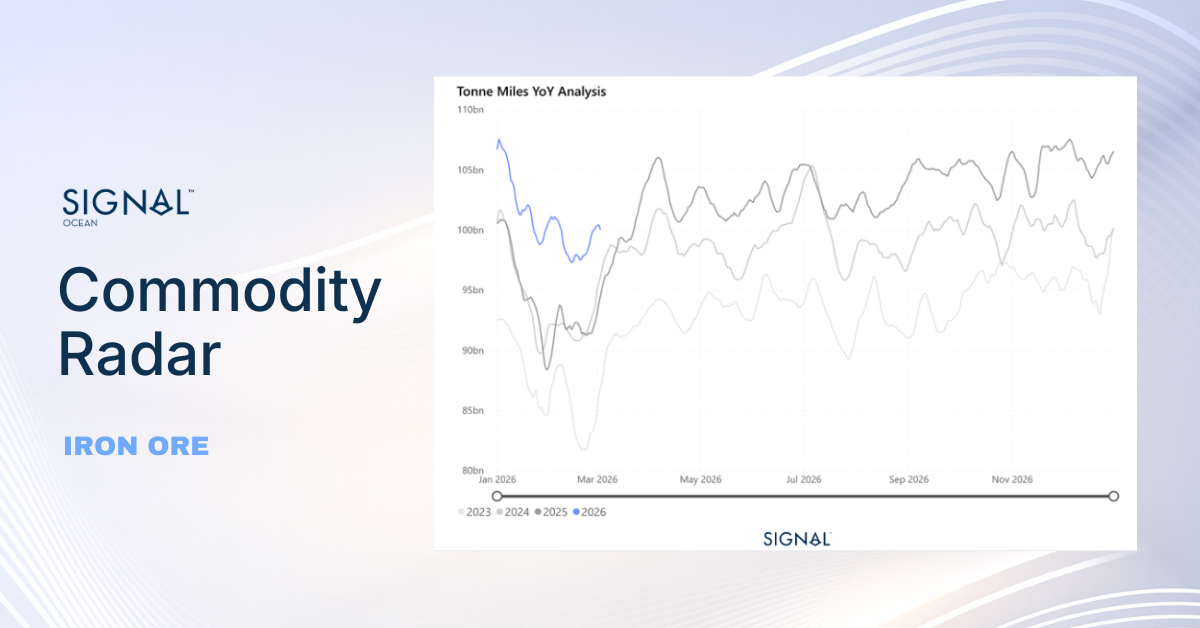
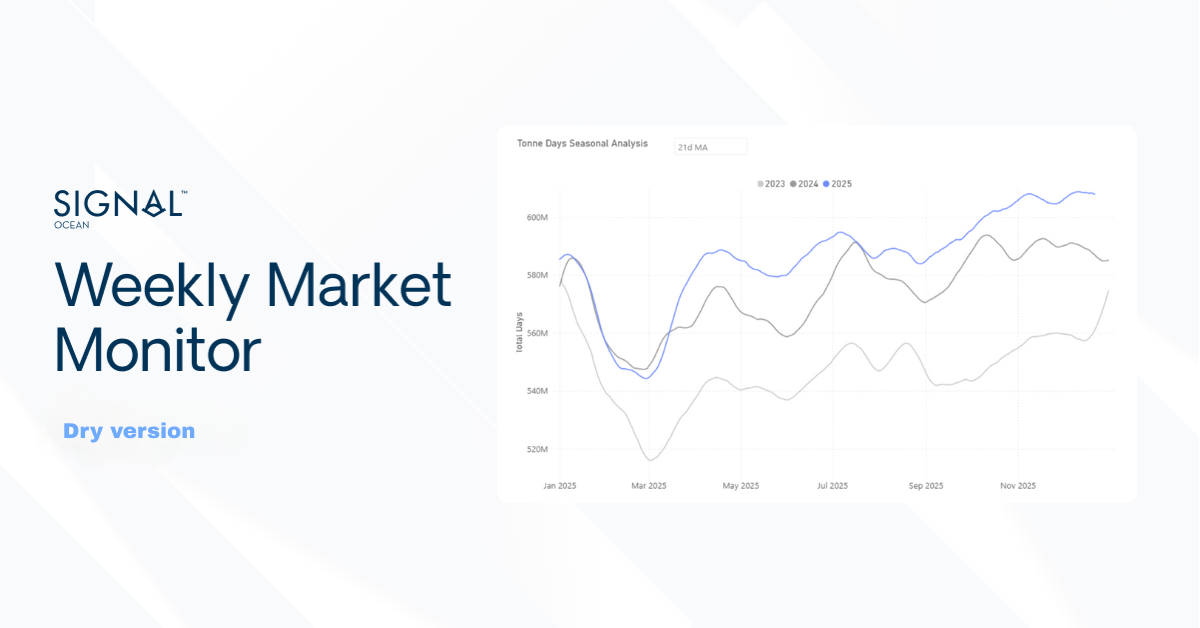
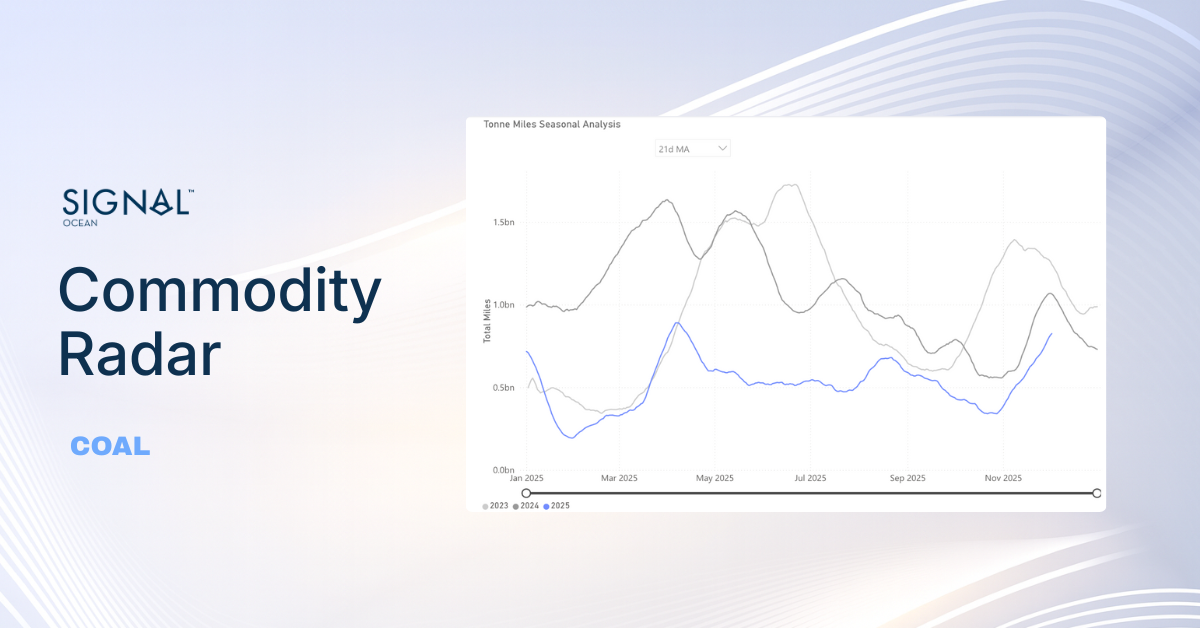
DEMAND| TONNE MILES - 7D MA- INDEX VIEW
Capesize ↓ 0.2% WoW | Panamax ↓ 2.5% WoW
The tonne-mile growth rate, measured on a Base 100 Index basis, weakened for the larger vessel classes this week. The Capesize index declined to 87.7, down 0.6% WoW from 87.9. The Panamax index also fell to 93.1, decreasing 2.6% WoW from 95.5. Despite the softer weekly performance, Panamax remains closer to the Base 100 benchmark, while Capesize continues to lag more significantly. Capesize now sits 12.3 points below base, while Panamax stands 6.9 points below the benchmark.
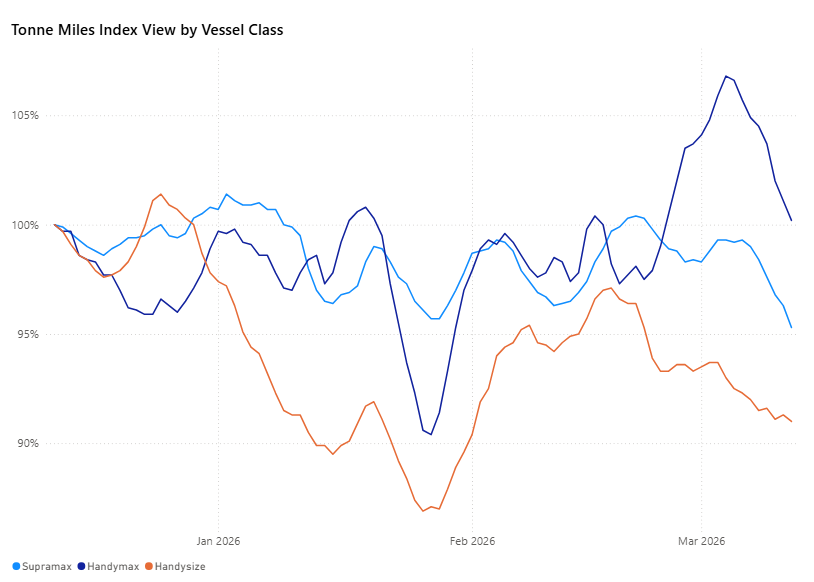
The tonne-mile growth rate, measured on a Base 100 Index basis, showed a mixed trend this week. Supramax declined to 95.9% from 98.3% WoW, while Handysize also eased to 94.9% from 96.2%. In contrast, Handymax remained above the benchmark at 105.8%, although slightly lower than 107% the previous week.
Metrics Description: Index View (Base 100) by total Tonne Miles over the selected period. This facilitates relative performance comparisons between segments of different sizes (e.g., comparing the growth rate of Supramax vs Capesize)
Maria holds a M.Sc. in Shipping, Trade and Finance from the Bayes Business School at the City University in London and a B.Sc. in Shipping Economics from the University of Piraeus.
Creating a sustainable world requires us to embark on a journey towards a zero emission future, where every step is a commitment to preserve our planet for future generations.
Albert Greenway
Environmental Scientist, Sustainability Expert
No items found.
Increased Use of Renewable Energy:
Shipping companies are embracing renewable energy sources to power onboard systems and reduce emissions during port operations. Solar panels and wind turbines are being installed on vessels to generate clean energy, reducing reliance on auxiliary engines, and cutting down emissions. Shore power facilities in ports allow ships to connect to the electrical grid, eliminating the need for onboard generators while docked.
Collaboration and Industry Partnerships:
Recognizing that addressing emissions requires collective action, shipping companies, governments, and organizations have formed partnerships and collaborations. These initiatives focus on research and development, sharing best practices, and promoting knowledge transfer. Joint projects aim to develop and deploy innovative technologies, improve infrastructure, and create a supportive regulatory framework to accelerate the industry's transition towards a greener future. The Zero Emission Shipping - Mission Innovation.
To pave the way for a greener future in shipping, the availability of alternative fuels plays a vital role in their widespread adoption. However, this availability is influenced by factors such as port infrastructure, local regulations, and government policies. As the demand for cleaner fuels in shipping rises and environmental regulations become more stringent, efforts are underway to improve the accessibility of these fuels through infrastructure development, collaborations, and investments in production facilities.
Liquefied Natural Gas (LNG) infrastructure has seen significant growth in recent years, resulting in more LNG bunkering facilities and LNG-powered vessels. Nonetheless, the availability of LNG as a marine fuel can still vary depending on the region. To ensure consistent availability worldwide, there is a need for further development of LNG supply chains and infrastructure. For biofuels, their availability hinges on production capacity and the availability of feedstock. Although biofuels are being produced and utilized in various sectors, their availability as a marine fuel remains limited. Scaling up biofuel production and establishing robust supply chains are imperative to ensure wider availability within the shipping industry.Hydrogen, as a fuel for maritime applications, is still in the early stages of infrastructure development. While some hydrogen vessels have been tested or introduced in the first quarter of last year, the infrastructure required for hydrogen production and distribution needs further advancement.
Ammonia, as a marine fuel, currently faces limitations in availability. The production, storage, and handling infrastructure for ammonia need further development to support its widespread use in the shipping industry.Methanol, on the other hand, is already a commercially available fuel and has been used as a blend with conventional fuels in some ships. However, its availability as a standalone marine fuel can still be limited in certain regions. Bureau Veritas in October 2022 published a White Paper for the Alternative Fuels Outlook. This white paper provides a comprehensive overview of alternative fuels for the shipping industry, taking into account key factors such as technological maturity, availability, safety, emissions, and regulations.
Creating a sustainable world requires us to embark on a journey towards a zero emission future, where every step is a commitment to preserve our planet for future generations.
Albert Greenway
Environmental Scientist, Sustainability Expert
Increased Use of Renewable Energy:
Shipping companies are embracing renewable energy sources to power onboard systems and reduce emissions during port operations. Solar panels and wind turbines are being installed on vessels to generate clean energy, reducing reliance on auxiliary engines, and cutting down emissions. Shore power facilities in ports allow ships to connect to the electrical grid, eliminating the need for onboard generators while docked.
Collaboration and Industry Partnerships:
Recognizing that addressing emissions requires collective action, shipping companies, governments, and organizations have formed partnerships and collaborations. These initiatives focus on research and development, sharing best practices, and promoting knowledge transfer. Joint projects aim to develop and deploy innovative technologies, improve infrastructure, and create a supportive regulatory framework to accelerate the industry's transition towards a greener future. The Zero Emission Shipping - Mission Innovation.
To pave the way for a greener future in shipping, the availability of alternative fuels plays a vital role in their widespread adoption. However, this availability is influenced by factors such as port infrastructure, local regulations, and government policies. As the demand for cleaner fuels in shipping rises and environmental regulations become more stringent, efforts are underway to improve the accessibility of these fuels through infrastructure development, collaborations, and investments in production facilities.
Liquefied Natural Gas (LNG) infrastructure has seen significant growth in recent years, resulting in more LNG bunkering facilities and LNG-powered vessels. Nonetheless, the availability of LNG as a marine fuel can still vary depending on the region. To ensure consistent availability worldwide, there is a need for further development of LNG supply chains and infrastructure. For biofuels, their availability hinges on production capacity and the availability of feedstock. Although biofuels are being produced and utilized in various sectors, their availability as a marine fuel remains limited. Scaling up biofuel production and establishing robust supply chains are imperative to ensure wider availability within the shipping industry.Hydrogen, as a fuel for maritime applications, is still in the early stages of infrastructure development. While some hydrogen vessels have been tested or introduced in the first quarter of last year, the infrastructure required for hydrogen production and distribution needs further advancement.
Ammonia, as a marine fuel, currently faces limitations in availability. The production, storage, and handling infrastructure for ammonia need further development to support its widespread use in the shipping industry.Methanol, on the other hand, is already a commercially available fuel and has been used as a blend with conventional fuels in some ships. However, its availability as a standalone marine fuel can still be limited in certain regions. Bureau Veritas in October 2022 published a White Paper for the Alternative Fuels Outlook. This white paper provides a comprehensive overview of alternative fuels for the shipping industry, taking into account key factors such as technological maturity, availability, safety, emissions, and regulations.


.png)


.png)
.png)


.png)
.png)
.png)

.png)
.png)
.png)
.png)
.png)
.png)
.png)
.png)
.png)
.png)
.png)
.png)


.avif)
.avif)
.avif)
.avif)
.avif)
.avif)
.avif)


.avif)