Subscribe for our latest news, straight to your inbox:
Thank you! Your submission has been received!
Oops! Something went wrong while submitting the form.
Share this post
Surge in Relet Vessels Impacting the Tanker Market
In the last six months, the number of relet vessels on the spot market has doubled. "Relets" are vessels professionally operated by oil companies that trade on the spot market.
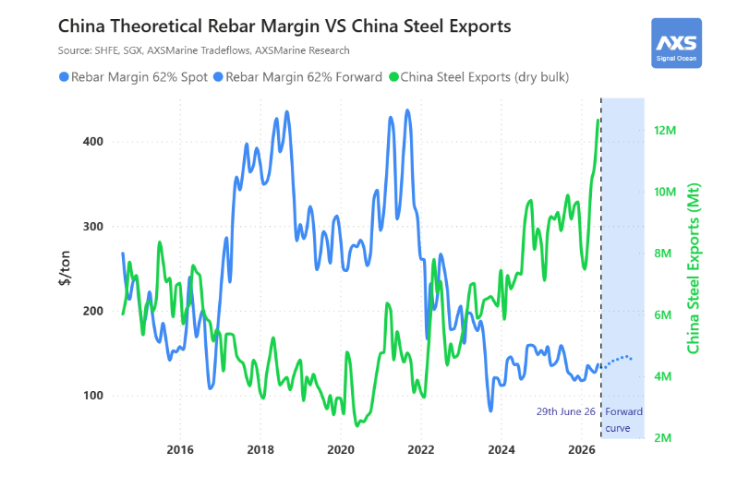
So far in 2020 we have seen remarkable conditions in the tanker market. Covid-19 caused drastic changes to supply and demand levels, from delays at ports to significant demand to oil storage, and there was a drastic collapse in oil pricing. When demand for floating storage spiked, oil companies hedged their exposure through time charters. In the graph below, you can see this trend on a weekly basis.
The Signal Ocean Platform continuously tracks and updates the market deployment status of tankers as one of the outputs of the fusion of geospatial information and commercial information. This makes it easy to aggregate data and easily spot these trends. The data analysed here comes from The Signal Ocean Platform using data from Signal Maritime’s account.
The graph below shows the growing trend of Aframax relet vessels and programme tonnage as charterers have expanded their commercial fleet sizein recent months. When oil programmes are "long" in tonnage, the quantity of relets in the spot market increases.
Aframax in the Spot Market vs. Aframax in the Relet/Contract/Program (source: The Signal Ocean Platform using data from Signal Maritime’s account)
Indeed, oil companies have emerged as some of the largest commercial operators in today's freightmarket.The graph below shows chosen charterers and a breakdown of their large, dirty vessels between January and May 2020.
The breakdown, by vessel type, of vessels per commercial operator for January and May 2020 (source: The Signal Ocean Platform using data from Signal Maritime’s account)
Until the wave of time charters that began in March 2020 re-delivers, we may see this surge of relet tonnage dampen the recent freight market volatility.
How has this affected freight rates so far? The solid blue line in the graph below reflects the number of relet vessels in comparison to the three primary Aframax freight markets (US Gulf, Mediterranean, and Far East).
Aframax Relet Vessels vs Market Rates (source: The Signal Ocean Platform using data from Signal Maritime’s account)
We see that this impact can be felt in key Aframax freight markets globally.
How long do you think these market conditions will last?
Creating a sustainable world requires us to embark on a journey towards a zero emission future, where every step is a commitment to preserve our planet for future generations.
Albert Greenway
Environmental Scientist, Sustainability Expert
No items found.
Increased Use of Renewable Energy:
Shipping companies are embracing renewable energy sources to power onboard systems and reduce emissions during port operations. Solar panels and wind turbines are being installed on vessels to generate clean energy, reducing reliance on auxiliary engines, and cutting down emissions. Shore power facilities in ports allow ships to connect to the electrical grid, eliminating the need for onboard generators while docked.
Collaboration and Industry Partnerships:
Recognizing that addressing emissions requires collective action, shipping companies, governments, and organizations have formed partnerships and collaborations. These initiatives focus on research and development, sharing best practices, and promoting knowledge transfer. Joint projects aim to develop and deploy innovative technologies, improve infrastructure, and create a supportive regulatory framework to accelerate the industry's transition towards a greener future. The Zero Emission Shipping - Mission Innovation.
To pave the way for a greener future in shipping, the availability of alternative fuels plays a vital role in their widespread adoption. However, this availability is influenced by factors such as port infrastructure, local regulations, and government policies. As the demand for cleaner fuels in shipping rises and environmental regulations become more stringent, efforts are underway to improve the accessibility of these fuels through infrastructure development, collaborations, and investments in production facilities.
Liquefied Natural Gas (LNG) infrastructure has seen significant growth in recent years, resulting in more LNG bunkering facilities and LNG-powered vessels. Nonetheless, the availability of LNG as a marine fuel can still vary depending on the region. To ensure consistent availability worldwide, there is a need for further development of LNG supply chains and infrastructure. For biofuels, their availability hinges on production capacity and the availability of feedstock. Although biofuels are being produced and utilized in various sectors, their availability as a marine fuel remains limited. Scaling up biofuel production and establishing robust supply chains are imperative to ensure wider availability within the shipping industry.Hydrogen, as a fuel for maritime applications, is still in the early stages of infrastructure development. While some hydrogen vessels have been tested or introduced in the first quarter of last year, the infrastructure required for hydrogen production and distribution needs further advancement.
Ammonia, as a marine fuel, currently faces limitations in availability. The production, storage, and handling infrastructure for ammonia need further development to support its widespread use in the shipping industry.Methanol, on the other hand, is already a commercially available fuel and has been used as a blend with conventional fuels in some ships. However, its availability as a standalone marine fuel can still be limited in certain regions. Bureau Veritas in October 2022 published a White Paper for the Alternative Fuels Outlook. This white paper provides a comprehensive overview of alternative fuels for the shipping industry, taking into account key factors such as technological maturity, availability, safety, emissions, and regulations.
Creating a sustainable world requires us to embark on a journey towards a zero emission future, where every step is a commitment to preserve our planet for future generations.
Albert Greenway
Environmental Scientist, Sustainability Expert
Increased Use of Renewable Energy:
Shipping companies are embracing renewable energy sources to power onboard systems and reduce emissions during port operations. Solar panels and wind turbines are being installed on vessels to generate clean energy, reducing reliance on auxiliary engines, and cutting down emissions. Shore power facilities in ports allow ships to connect to the electrical grid, eliminating the need for onboard generators while docked.
Collaboration and Industry Partnerships:
Recognizing that addressing emissions requires collective action, shipping companies, governments, and organizations have formed partnerships and collaborations. These initiatives focus on research and development, sharing best practices, and promoting knowledge transfer. Joint projects aim to develop and deploy innovative technologies, improve infrastructure, and create a supportive regulatory framework to accelerate the industry's transition towards a greener future. The Zero Emission Shipping - Mission Innovation.
To pave the way for a greener future in shipping, the availability of alternative fuels plays a vital role in their widespread adoption. However, this availability is influenced by factors such as port infrastructure, local regulations, and government policies. As the demand for cleaner fuels in shipping rises and environmental regulations become more stringent, efforts are underway to improve the accessibility of these fuels through infrastructure development, collaborations, and investments in production facilities.
Liquefied Natural Gas (LNG) infrastructure has seen significant growth in recent years, resulting in more LNG bunkering facilities and LNG-powered vessels. Nonetheless, the availability of LNG as a marine fuel can still vary depending on the region. To ensure consistent availability worldwide, there is a need for further development of LNG supply chains and infrastructure. For biofuels, their availability hinges on production capacity and the availability of feedstock. Although biofuels are being produced and utilized in various sectors, their availability as a marine fuel remains limited. Scaling up biofuel production and establishing robust supply chains are imperative to ensure wider availability within the shipping industry.Hydrogen, as a fuel for maritime applications, is still in the early stages of infrastructure development. While some hydrogen vessels have been tested or introduced in the first quarter of last year, the infrastructure required for hydrogen production and distribution needs further advancement.
Ammonia, as a marine fuel, currently faces limitations in availability. The production, storage, and handling infrastructure for ammonia need further development to support its widespread use in the shipping industry.Methanol, on the other hand, is already a commercially available fuel and has been used as a blend with conventional fuels in some ships. However, its availability as a standalone marine fuel can still be limited in certain regions. Bureau Veritas in October 2022 published a White Paper for the Alternative Fuels Outlook. This white paper provides a comprehensive overview of alternative fuels for the shipping industry, taking into account key factors such as technological maturity, availability, safety, emissions, and regulations.


.png)


.png)


.png)

.png)

.png)


.png)


.avif)


.avif)


