Back to Weekly Market Monitors

Weekly Tanker Market Monitor: Week 28, 2026

Tankers
July 10, 2026

SPOTLIGHT OF THE WEEK

Crude Tanker Orderbook Broke Its 2008 Record in 1H

With the United States and Iran breaking the ceasefire again this week, the freight market has reacted sharply, resuming its upward trend within days as risk premia around the Strait of Hormuz returned. The Baltic Dirty Tanker Index and the benchmark Middle East Gulf-to-China VLCC route (TD3C) both firmed on the week. This week, however, the focus shifts beyond short-term freight rate movements to the exceptional pace of VLCC newbuilding orders recorded during the first half of 2026. 
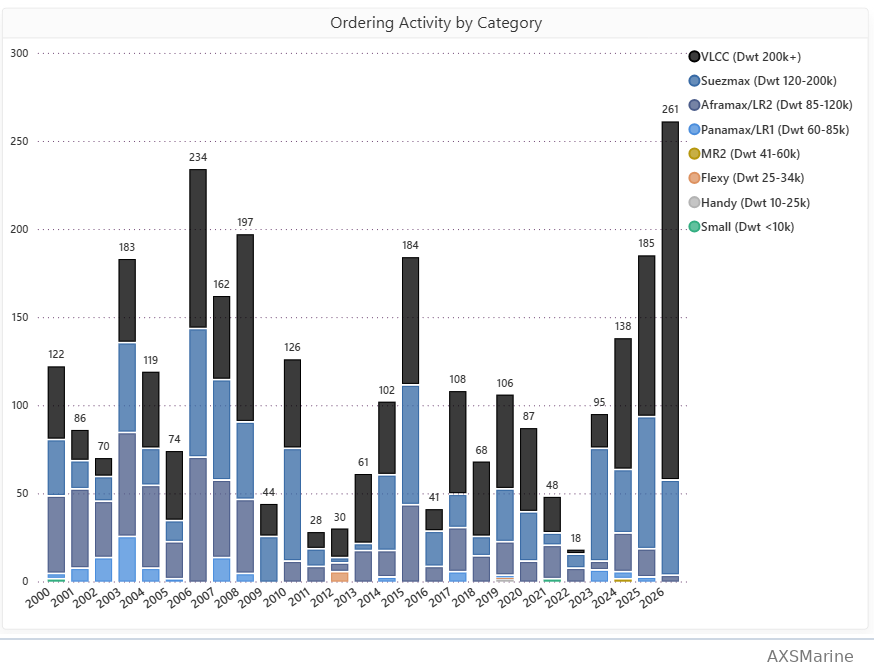
Figure 1: Crude tanker ordering by vessel class category. Source: AXS Insights, Tanker Orderbook

EXECUTIVE SUMMARY

•  2008 record broken in a single half-year: Driven by the robust contracting activity observed during the first half of 2026, the crude tanker orderbook has exceeded its 2008 historical maximum, expanding beyond 600 dirty tankers.

•  VLCCs dominate the ordering cycle: This unprecedented volume is overwhelmingly driven by the VLCC segment, which accounts for 78% of the orders contracted in H1 2026. This stands in sharp contrast to the previous major wave in 2006, which saw orders evenly distributed for VLCC, Suezmax, and Aframax sizes. 

• • Second-hand premiums reinforce newbuilding demand: Strong secondhand asset prices continue to support contracting, with buyers paying premiums for prompt availability and 5-year resale values reaching $174.5m, well above the newbuilding price of $129.8m.

•  Geopolitical risk underpins investment sentiment: The scale and timing of the ordering wave coincided with the months-long Strait of Hormuz risk premium, while the renewed ceasefire breakdown has again lifted freight rates.

Freight Market — Dirty Rates Turn Higher on Renewed Hormuz Risk

The weekly freight reaction underscores the sensitivity of dirty-tanker rates to the renewed Hormuz risk. As of  8 July, the TD3C (Middle East Gulf–China) benchmark stood at 343 WS, up 7.1% on the day and 16.8% on the week after recovering from a recent low of 294 WS on 1 July. TD3C reached 501 WS on 23 June, six days after the 17 June Islamabad Memorandum of Understanding (MoU) established a 60-day framework for ending hostilities and restoring navigation through the Strait of Hormuz. Despite the agreement, freight rates continued to reflect elevated geopolitical uncertainty before easing as confidence in implementation gradually improved. This week's renewed escalation has interrupted that easing trend.

The Baltic Dirty Tanker Index (BDTI) rose to 1,939, up 4.0% week-on-week. The index remains 107.4% above its level a year earlier, indicating that freight markets continue to price a significant geopolitical risk premium amid persistent uncertainty in the Gulf.
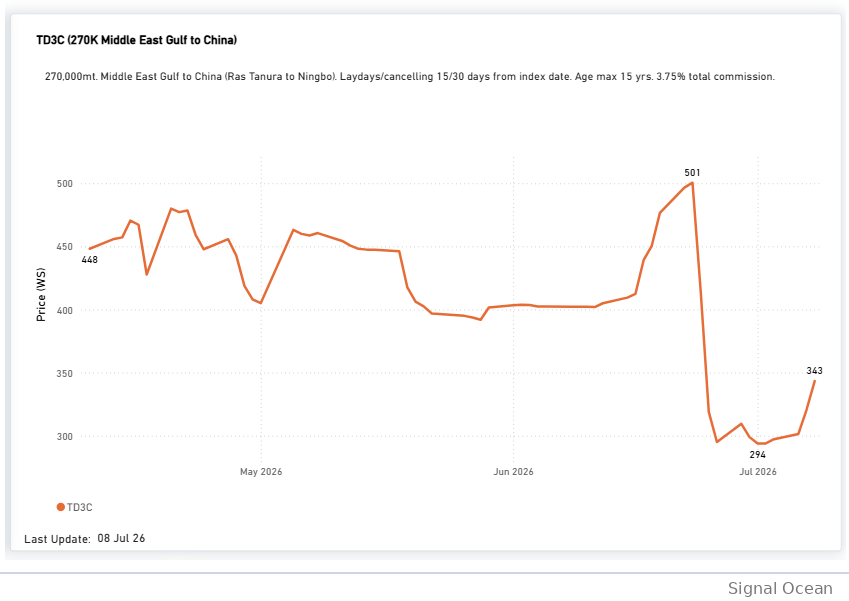
Figure 2: TD3C (270k Middle East Gulf to China). Source: Signal Ocean,  Market Prices

Freight snapshot (TD3C):  343 WS  ·  Day +7.1%  ·  Week +16.8%  ·  52-wk high 599  ·  wartime peak 501

VLCCs Dominate in the Ordering Activity — and the Comparison With 2006 Peak

Isolating the VLCC segment shows contracting rising to 204 units in H1 2026, a level far above the intervening lean years of 2011–2022. The comparison with 2007 — the last great newbuilding wave — is instructive. In 2006, activity was spread almost evenly between the three principal crude sizes: Suezmax (57), VLCC (48), and Aframax/LR2 (44). 

Figure 3: Crude tanker ordering by vessel class category. Source: AXS Insights, Tanker Orderbook

2006 vs. H1 2026:  VLCC 48 → 204  ·  Suezmax 57 → 54  ·  Aframax/LR2 44 → 3  

Build Location — China Dominates Crude Tanker Contacting Activity

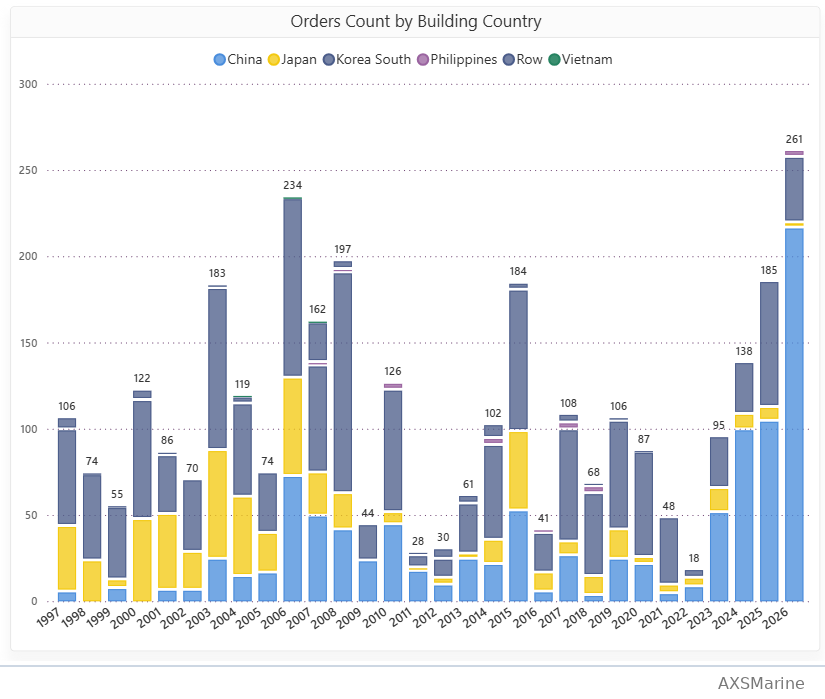
Of the 261 crude tankers on order, 216 vessels (83%) have been placed at Chinese shipyards, compared with 38 vessels (15%) at South Korean yards and just 3 vessels (1%) in Japan

Figure 5: Orders by building country. Source: AXS Insights, Tanker Orderbook

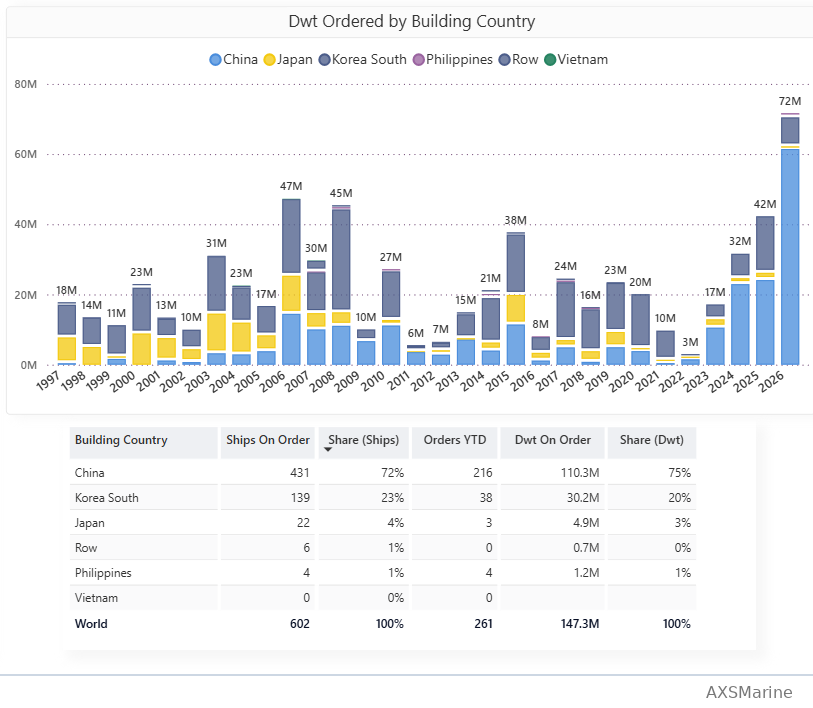
At the aggregate orderbook level, China accounts for 72% of ships and 75% of deadweight on order, versus 13% of ships and 20% of deadweight for South Korea, while Japan represents 1% of ships and 3% of deadweight

Figure 6: Orders by DWT and building country. Source: AXS Insights, Tanker Orderbook

Build-country split (ships on order):  China 432 (72%)  ·  Korea 139 (23%) · Japan 22 (4%)

Propulsion — Conventional Propulsion Regains Momentum

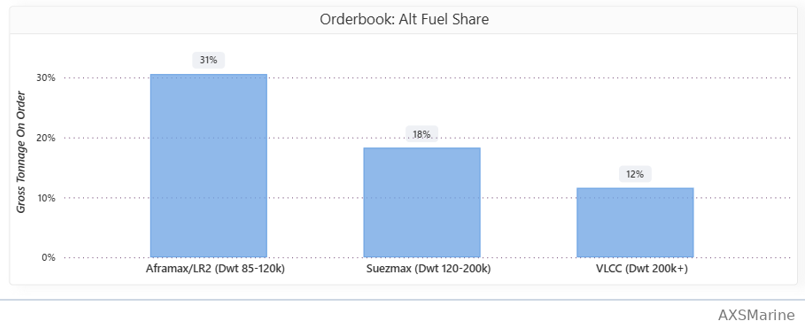
Conventional propulsion has reasserted its dominance in the current ordering cycle. Only 2% of crude tanker orders placed during H1 2026 specified alternative-fuel propulsion, exclusively LNG, compared with 12% across full-year 2025. While the figures are not directly comparable because 2026 covers only January–June, 98% of H1 2026 orders have been placed with conventional engines, indicating a strong preference for conventional propulsion. Across the current orderbook, however, alternative-fuel adoption varies by vessel class, accounting for 31% of Aframax/LR2 orders, 18% of Suezmax orders and 12% of VLCC orders, suggesting that uptake has remained more limited in the largest crude carriers. 
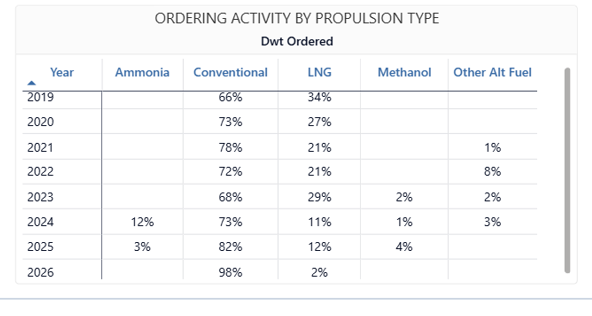
Figure 6 & 7: Ordering by propulsion type & orderbook alt-fuel share. Source: AXS Insights, Tanker Orderbook

Delivery Schedule — 2028 Marks the Peak of the Pipeline

The delivery schedule is heavily over the next three years, with volumes building steadily through 2027 before reaching a peak of 78 vessels in Q4 2028, the busiest quarter in the current orderbook. The late-2028 surge is overwhelmingly driven by VLCC (49, 60% of the total deliveries), while Suezmax deliveries are estimated to be more limited (23, 30% of the total). Following the Q4 2028 peak, quarterly deliveries moderate to 43 vessels in Q1 2029, 36 in Q2, 41 in Q3, and 26 in Q4, before falling to just 13 vessels in Q1 2030 and single-digit quarterly levels thereafter.
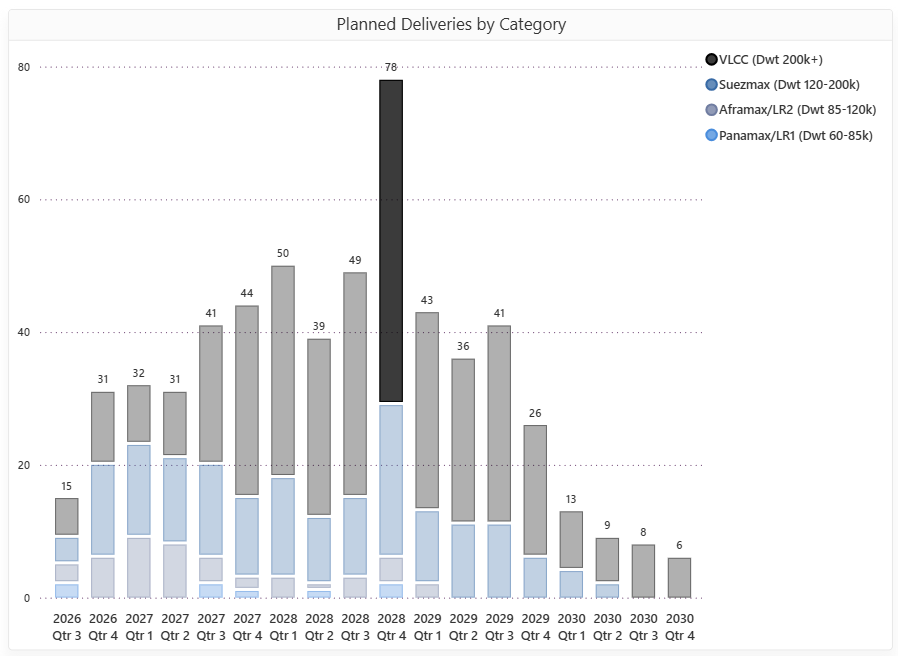
Figure 8: Crude tanker planned deliveries by vessel class category. Source: AXS Insights, Tanker Orderbook


Orderbook Evolution — The 2008 Record Is Broken

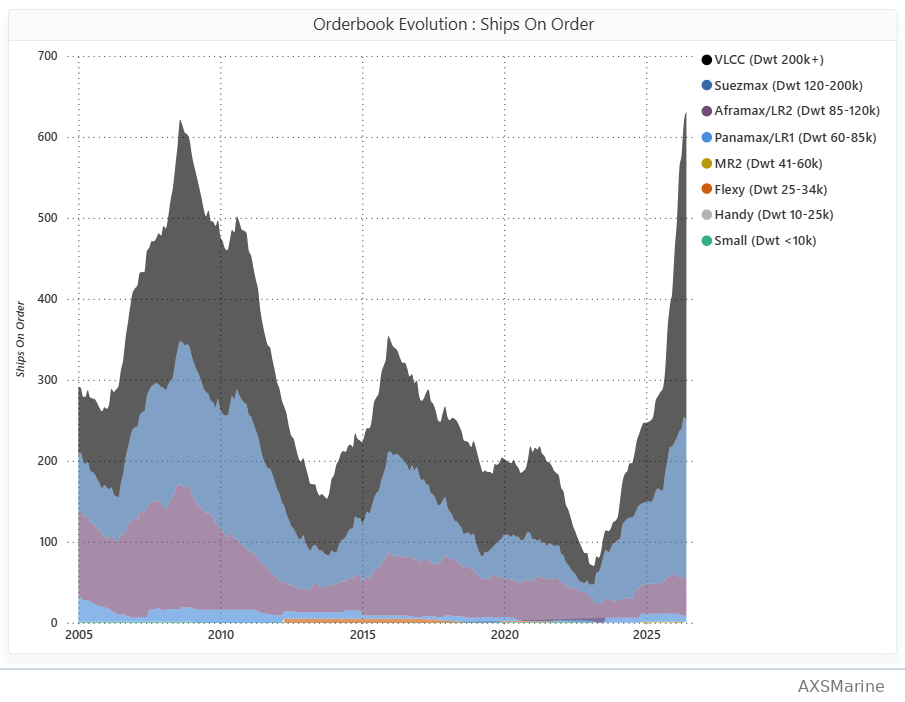
The orderbook reflects the scale of the current investment cycle. Contracting during the first half of 2026 has lifted the crude tanker orderbook above 600 vessels, surpassing the previous peak recorded in 2008 with half the year remaining. The expansion has been overwhelmingly concentrated in the VLCC segment, which now accounts for the largest share of the orderbook and has led the increase in contracting since the market bottomed in 2022–23

Figure 9: Orderbook evolution by vessel class category. Source: AXS Insights, Tanker Orderbook

Orderbook milestone:  600+ dirty tankers on order  ·  above the 2008 all-time peak  ·  VLCC-led

Asset Prices — The VLCC Value Trend Remains Intact

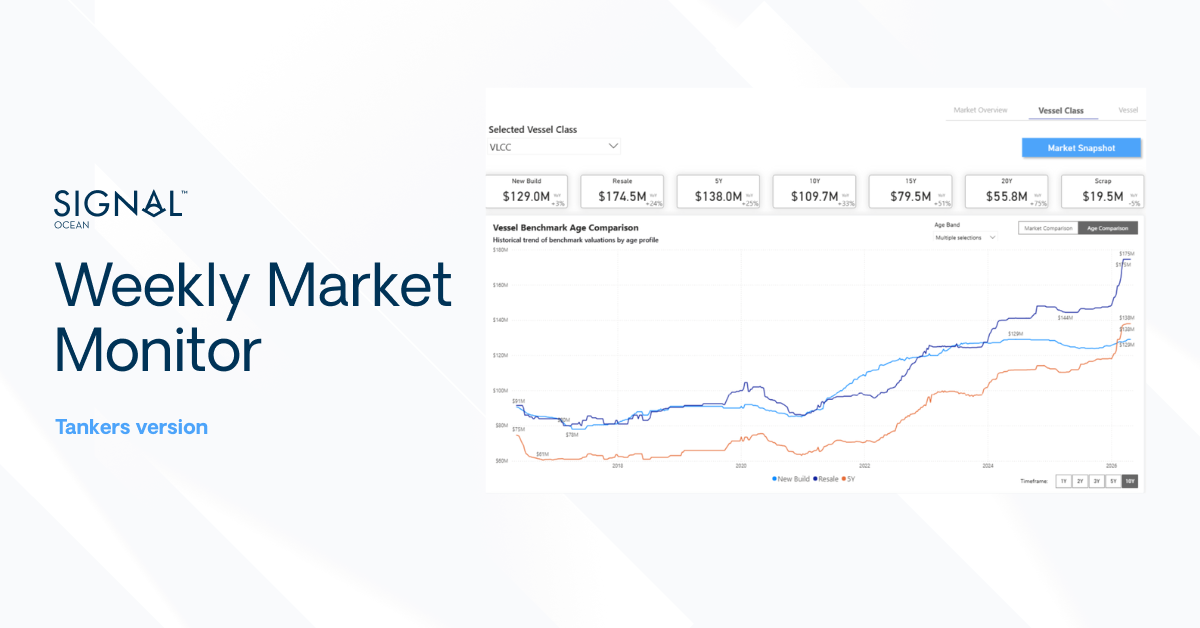
The latest valuation data extend the trend highlighted in our Week 19 Tanker Market Monitor, where VLCC asset prices were already moving well above newbuilding prices, and the age-discount curve was tightening. That trend remains intact. Across the VLCC age curve, values continue to advance, with the strongest year-on-year increases concentrated in older tonnage. Five-year-old VLCCs are now valued at $174.5m, compared with a newbuilding price of $129.8m, as buyers continue to pay a premium for prompt availability. With values strengthening across every age segment, the asset-price environment continues to support the record pace of VLCC ordering.
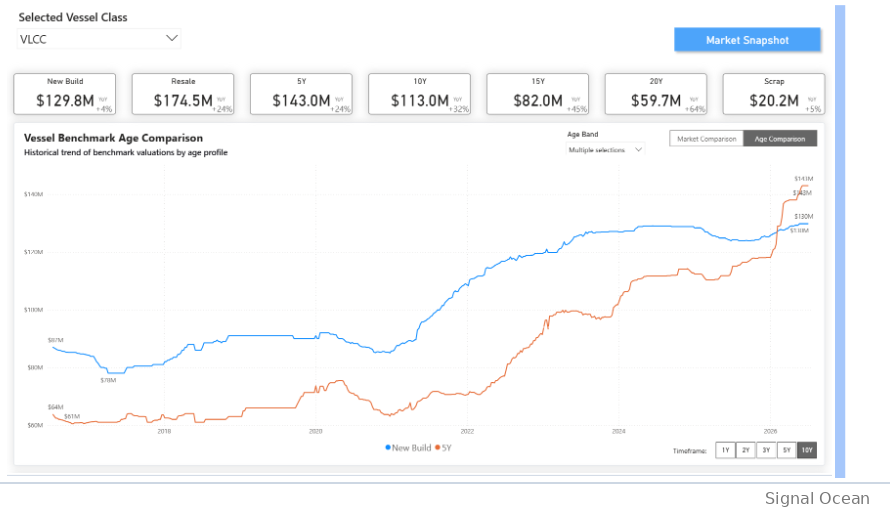
Figure 10: VLCC benchmark valuations by age. Source: Signal Ocean, Valuations

VLCC benchmark YoY:  New Build $129.8M (+4%)  ·  Resale $174.5M (+24%)  ·  5Y $143.0M (+24%)  ·  20Y $59.7M (+64%)

Key Takeaways

The first half of 2026 has already established a new benchmark for crude tanker contracting. With 261 orders placed, the period represents the strongest six-month ordering performance on record, lifting the crude tanker orderbook above its previous historical peak. The scale of contracting recorded in just six months exceeds the previous orderbook peak achieved over a full ordering cycle. Recent freight developments have provided a supportive market backdrop. Following this week's renewed U.S.–Iran tensions, dirty-tanker freight rates have turned higher after the correction from late-June highs, highlighting the continued sensitivity of the market to developments in the Strait of Hormuz.

For the latest updates and insights, make sure to visit the Signal Ocean Newsroom page & subscribe to weekly reports. Click here to request a demo. Click here to see the previous tanker weekly report.

For subscription to our FREE weekly market trends email, please contact us: research@thesignalgroup.com

-Republishing is allowed with an active link to the source

Maria Bertzeletou
Senior Market Analyst
LinkedIn
Maria holds a M.Sc. in Shipping, Trade and Finance from the Bayes Business School at the City University in London and a B.Sc. in Shipping Economics from the University of Piraeus.
Creating a sustainable world requires us to embark on a journey towards a zero emission future, where every step is a commitment to preserve our planet for future generations.
Albert Greenway
Environmental Scientist, Sustainability Expert
No items found.

Increased Use of Renewable Energy:

Shipping companies are embracing renewable energy sources to power onboard systems and reduce emissions during port operations. Solar panels and wind turbines are being installed on vessels to generate clean energy, reducing reliance on auxiliary engines, and cutting down emissions. Shore power facilities in ports allow ships to connect to the electrical grid, eliminating the need for onboard generators while docked.

Collaboration and Industry Partnerships:

Recognizing that addressing emissions requires collective action, shipping companies, governments, and organizations have formed partnerships and collaborations. These initiatives focus on research and development, sharing best practices, and promoting knowledge transfer. Joint projects aim to develop and deploy innovative technologies, improve infrastructure, and create a supportive regulatory framework to accelerate the industry's transition towards a greener future. The Zero Emission Shipping - Mission Innovation.

To pave the way for a greener future in shipping, the availability of alternative fuels plays a vital role in their widespread adoption. However, this availability is influenced by factors such as port infrastructure, local regulations, and government policies. As the demand for cleaner fuels in shipping rises and environmental regulations become more stringent, efforts are underway to improve the accessibility of these fuels through infrastructure development, collaborations, and investments in production facilities.

Liquefied Natural Gas (LNG) infrastructure has seen significant growth in recent years, resulting in more LNG bunkering facilities and LNG-powered vessels. Nonetheless, the availability of LNG as a marine fuel can still vary depending on the region. To ensure consistent availability worldwide, there is a need for further development of LNG supply chains and infrastructure. For biofuels, their availability hinges on production capacity and the availability of feedstock. Although biofuels are being produced and utilized in various sectors, their availability as a marine fuel remains limited. Scaling up biofuel production and establishing robust supply chains are imperative to ensure wider availability within the shipping industry.Hydrogen, as a fuel for maritime applications, is still in the early stages of infrastructure development. While some hydrogen vessels have been tested or introduced in the first quarter of last year, the infrastructure required for hydrogen production and distribution needs further advancement.

Ammonia, as a marine fuel, currently faces limitations in availability. The production, storage, and handling infrastructure for ammonia need further development to support its widespread use in the shipping industry.Methanol, on the other hand, is already a commercially available fuel and has been used as a blend with conventional fuels in some ships. However, its availability as a standalone marine fuel can still be limited in certain regions. Bureau Veritas in October 2022 published a White Paper for the Alternative Fuels Outlook. This white paper provides a comprehensive overview of alternative fuels for the shipping industry, taking into account key factors such as technological maturity, availability, safety, emissions, and regulations.

Creating a sustainable world requires us to embark on a journey towards a zero emission future, where every step is a commitment to preserve our planet for future generations.
Albert Greenway
Environmental Scientist, Sustainability Expert

Increased Use of Renewable Energy:

Shipping companies are embracing renewable energy sources to power onboard systems and reduce emissions during port operations. Solar panels and wind turbines are being installed on vessels to generate clean energy, reducing reliance on auxiliary engines, and cutting down emissions. Shore power facilities in ports allow ships to connect to the electrical grid, eliminating the need for onboard generators while docked.

Collaboration and Industry Partnerships:

Recognizing that addressing emissions requires collective action, shipping companies, governments, and organizations have formed partnerships and collaborations. These initiatives focus on research and development, sharing best practices, and promoting knowledge transfer. Joint projects aim to develop and deploy innovative technologies, improve infrastructure, and create a supportive regulatory framework to accelerate the industry's transition towards a greener future. The Zero Emission Shipping - Mission Innovation.

To pave the way for a greener future in shipping, the availability of alternative fuels plays a vital role in their widespread adoption. However, this availability is influenced by factors such as port infrastructure, local regulations, and government policies. As the demand for cleaner fuels in shipping rises and environmental regulations become more stringent, efforts are underway to improve the accessibility of these fuels through infrastructure development, collaborations, and investments in production facilities.

Liquefied Natural Gas (LNG) infrastructure has seen significant growth in recent years, resulting in more LNG bunkering facilities and LNG-powered vessels. Nonetheless, the availability of LNG as a marine fuel can still vary depending on the region. To ensure consistent availability worldwide, there is a need for further development of LNG supply chains and infrastructure. For biofuels, their availability hinges on production capacity and the availability of feedstock. Although biofuels are being produced and utilized in various sectors, their availability as a marine fuel remains limited. Scaling up biofuel production and establishing robust supply chains are imperative to ensure wider availability within the shipping industry.Hydrogen, as a fuel for maritime applications, is still in the early stages of infrastructure development. While some hydrogen vessels have been tested or introduced in the first quarter of last year, the infrastructure required for hydrogen production and distribution needs further advancement.

Ammonia, as a marine fuel, currently faces limitations in availability. The production, storage, and handling infrastructure for ammonia need further development to support its widespread use in the shipping industry.Methanol, on the other hand, is already a commercially available fuel and has been used as a blend with conventional fuels in some ships. However, its availability as a standalone marine fuel can still be limited in certain regions. Bureau Veritas in October 2022 published a White Paper for the Alternative Fuels Outlook. This white paper provides a comprehensive overview of alternative fuels for the shipping industry, taking into account key factors such as technological maturity, availability, safety, emissions, and regulations.

Ready to get started and outrun your competition?
Request a Demo

Read next