
.webp)


driving these stories

SPOTLIGHT OF THE WEEK | STEEL
Black Sea Steel Flows Weaken as Shipping Risks Rise

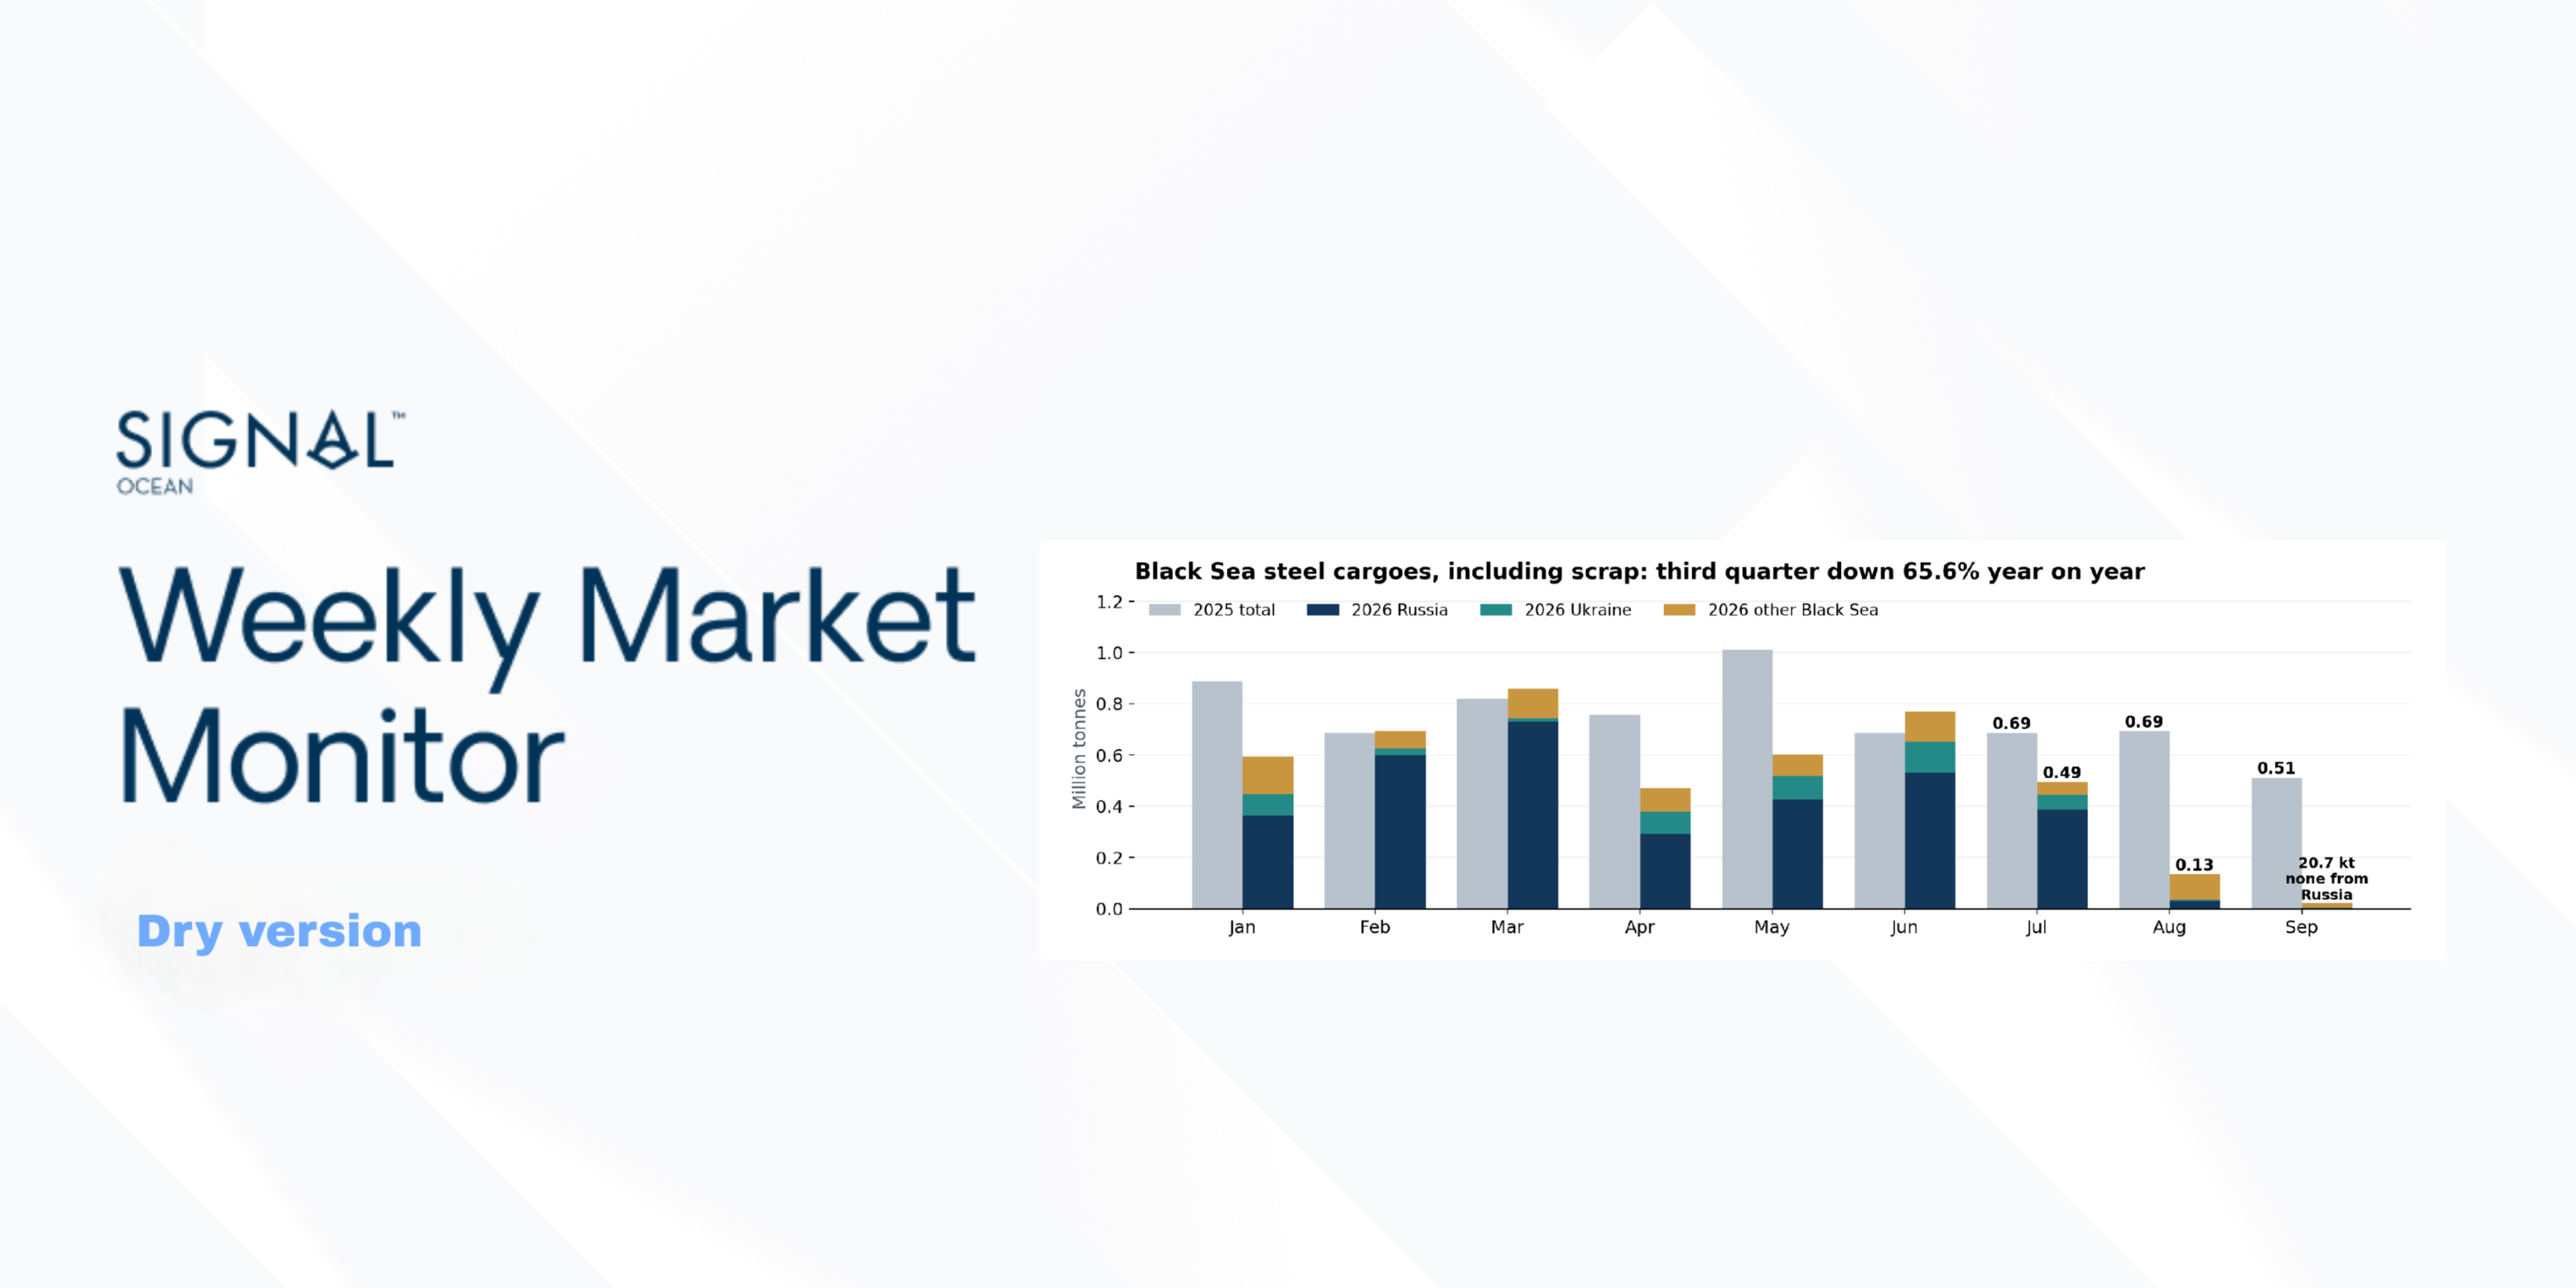
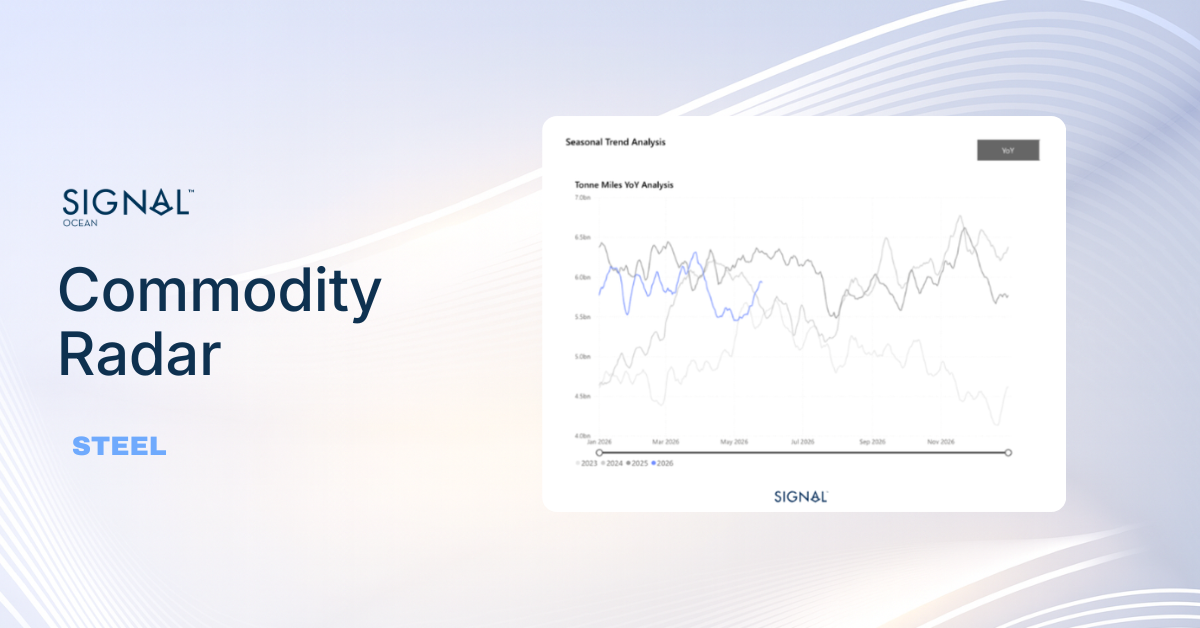
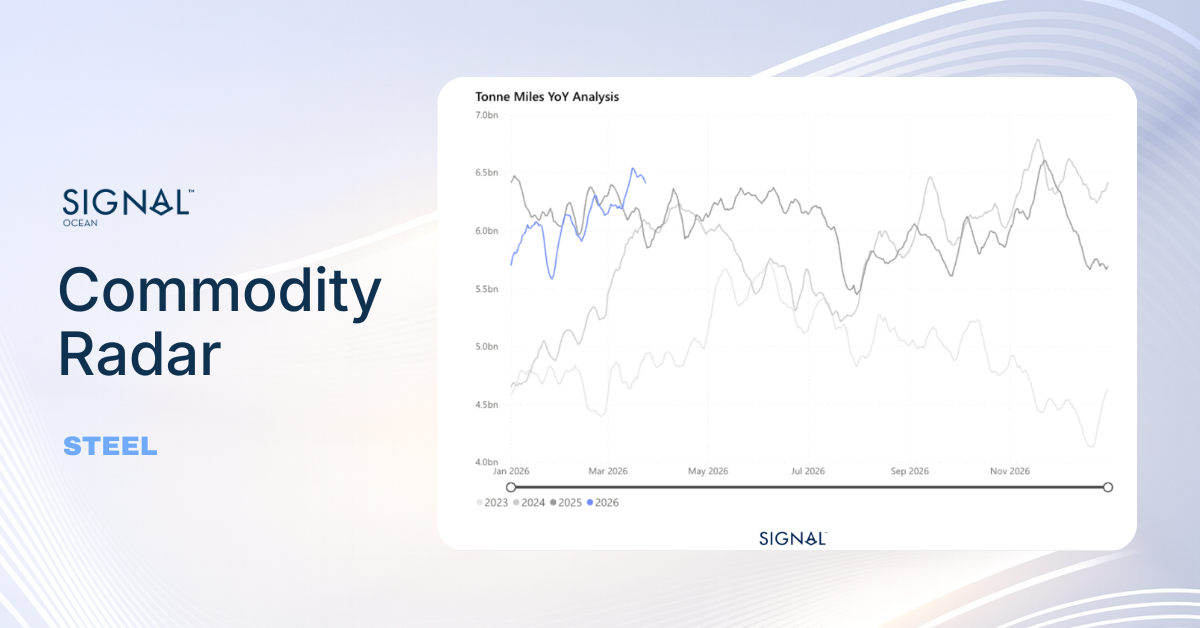
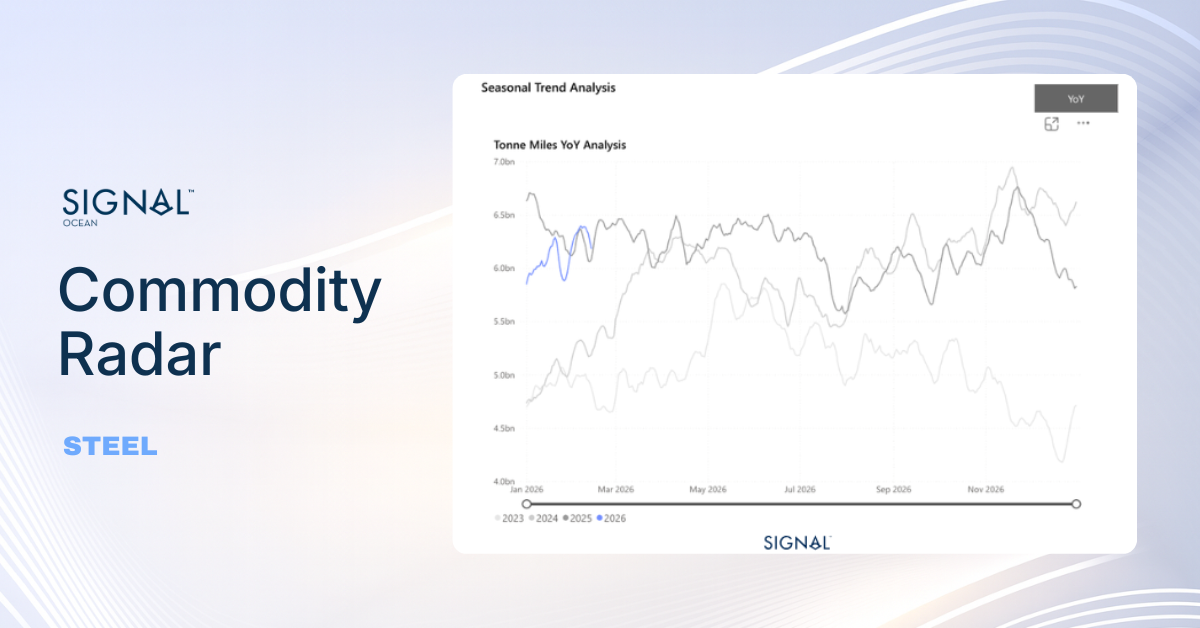
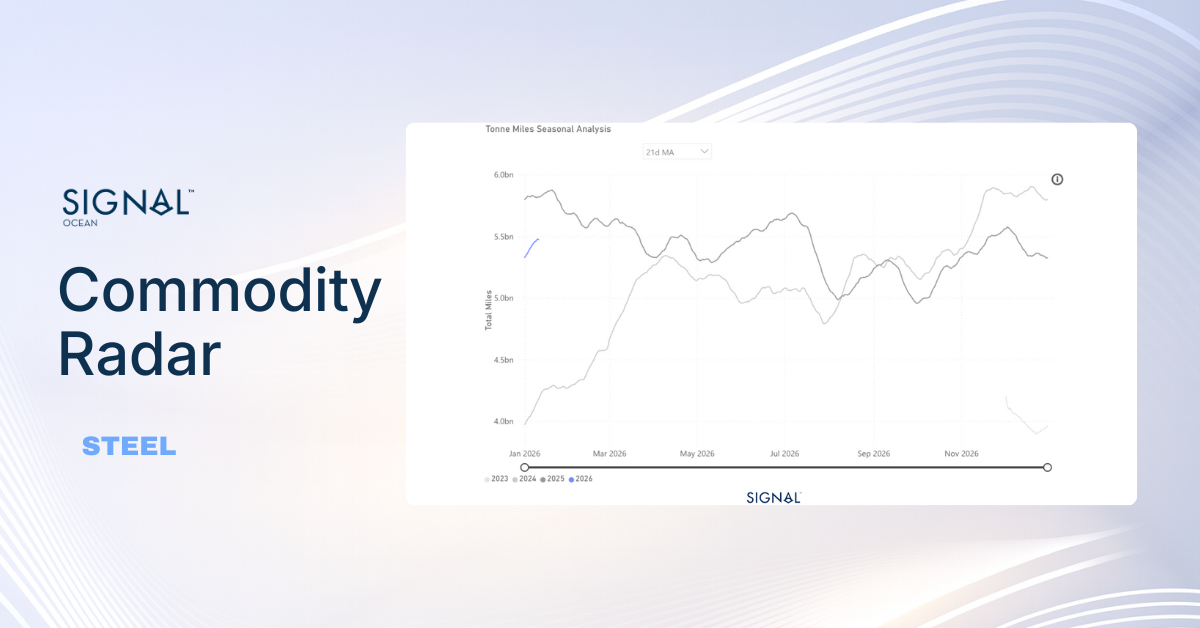
Recorded Black Sea steel loadings declined sharply in Q3 2026. Volumes, including scrap, fell 65.6% y/y to 0.65 Mt across 51 voyages, compared with 129 in Q3 2025. The year-on-year decline deepened through the quarter: July −28.0%, August −80.6%, and September −96.0%. September’s recorded volume totalled 20,690 t, comprising loadings from Turkey (12,750 t), Romania (4,970 t), and Ukraine (2,970 t). January–September volume reached 4.65 Mt, down 31.0% y/y, across 314 voyages, down 34.3%.
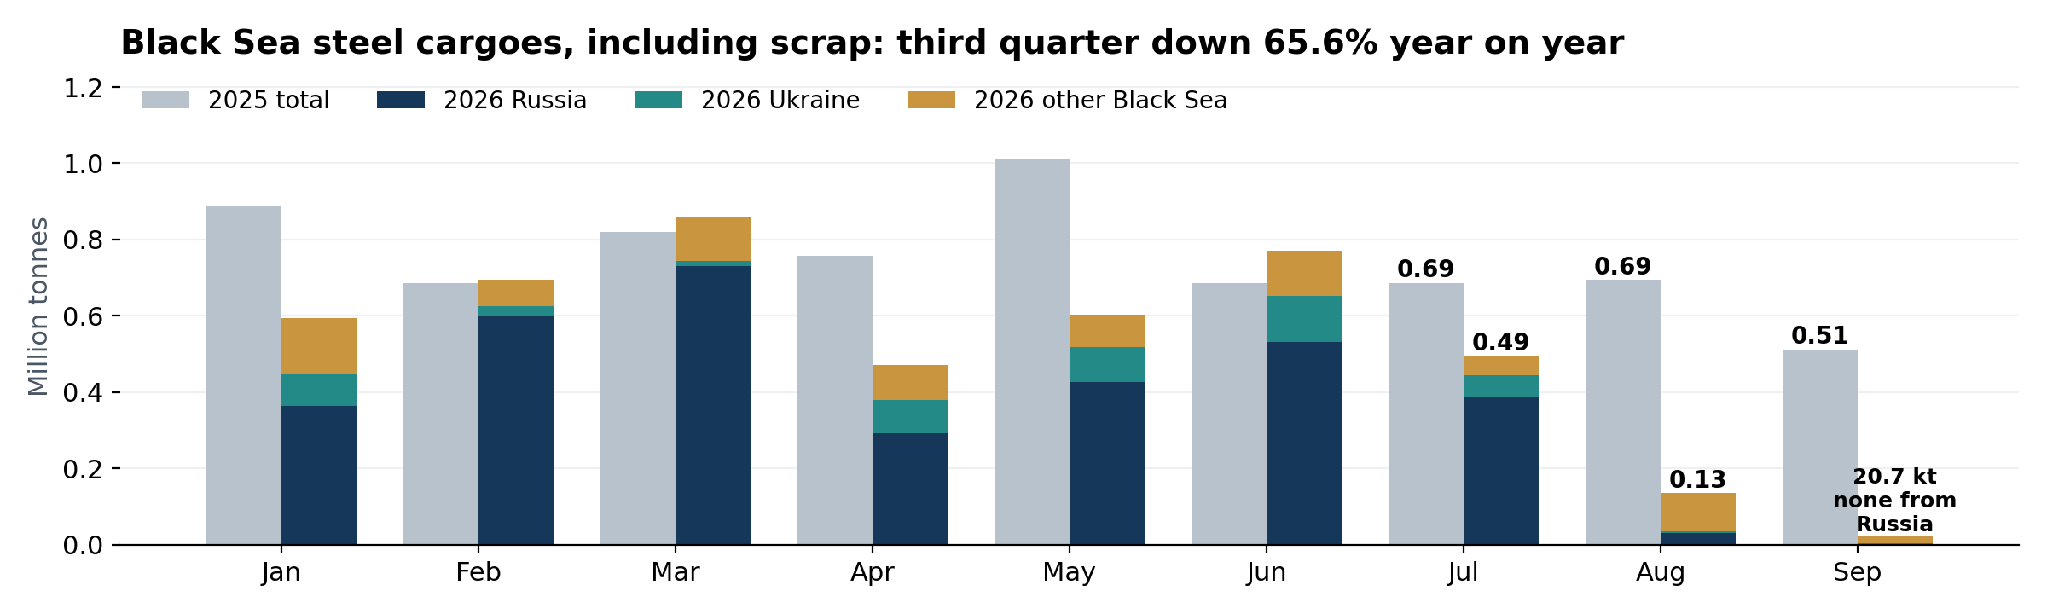
Russia and Ukraine account for most of the fall. Russia accounted for 3.36 Mt, or 72%, of the 4.65 Mt recorded in January–September. Its recorded loadings fell to 31,000 t on 2 voyages in August, against 553,000 t on 25 voyages in August 2025, and no Russian steel loadings were recorded from Black Sea ports in September within the selected Signal dataset, extracted on 13 October, against 364,000 t in September 2025; the latest recorded Russian loading was on 18 August. Ukraine’s recorded steel cargoes fell 78.8% in Q3 to 62,940 t, with about 3,000 t in each of August and September. Ukraine’s September crude steel output was reported at 131,000 t, about 79% lower y/y, and on 25 September ArcelorMittal said it could not safely and sustainably restart Kryvyi Rih, giving no timetable.
Voyage risk and reported insurance costs are rising. Four merchant vessels were reported sunk or damaged in the Black Sea on 5–6 October. Two further cargo vessels were struck off Bulgaria on 13 October: HS Dignity sank and Chelsea 3 sustained damage. Responsibility for some incidents remains disputed. Hull war-risk quotations reported by BPG Shipping through Ukrainian Shipping Magazine on 9 October were 0.6–1.0% of vessel value before discount, compared with 0.2–0.5% a week earlier, equivalent to 0.3–0.5% where a 50% no-claims discount applies. A subsequent broker report on 13 October indicated increased enquiries for war-risk cover for Ukrainian Black Sea ports and Danube-bound voyages, without providing an updated premium range.
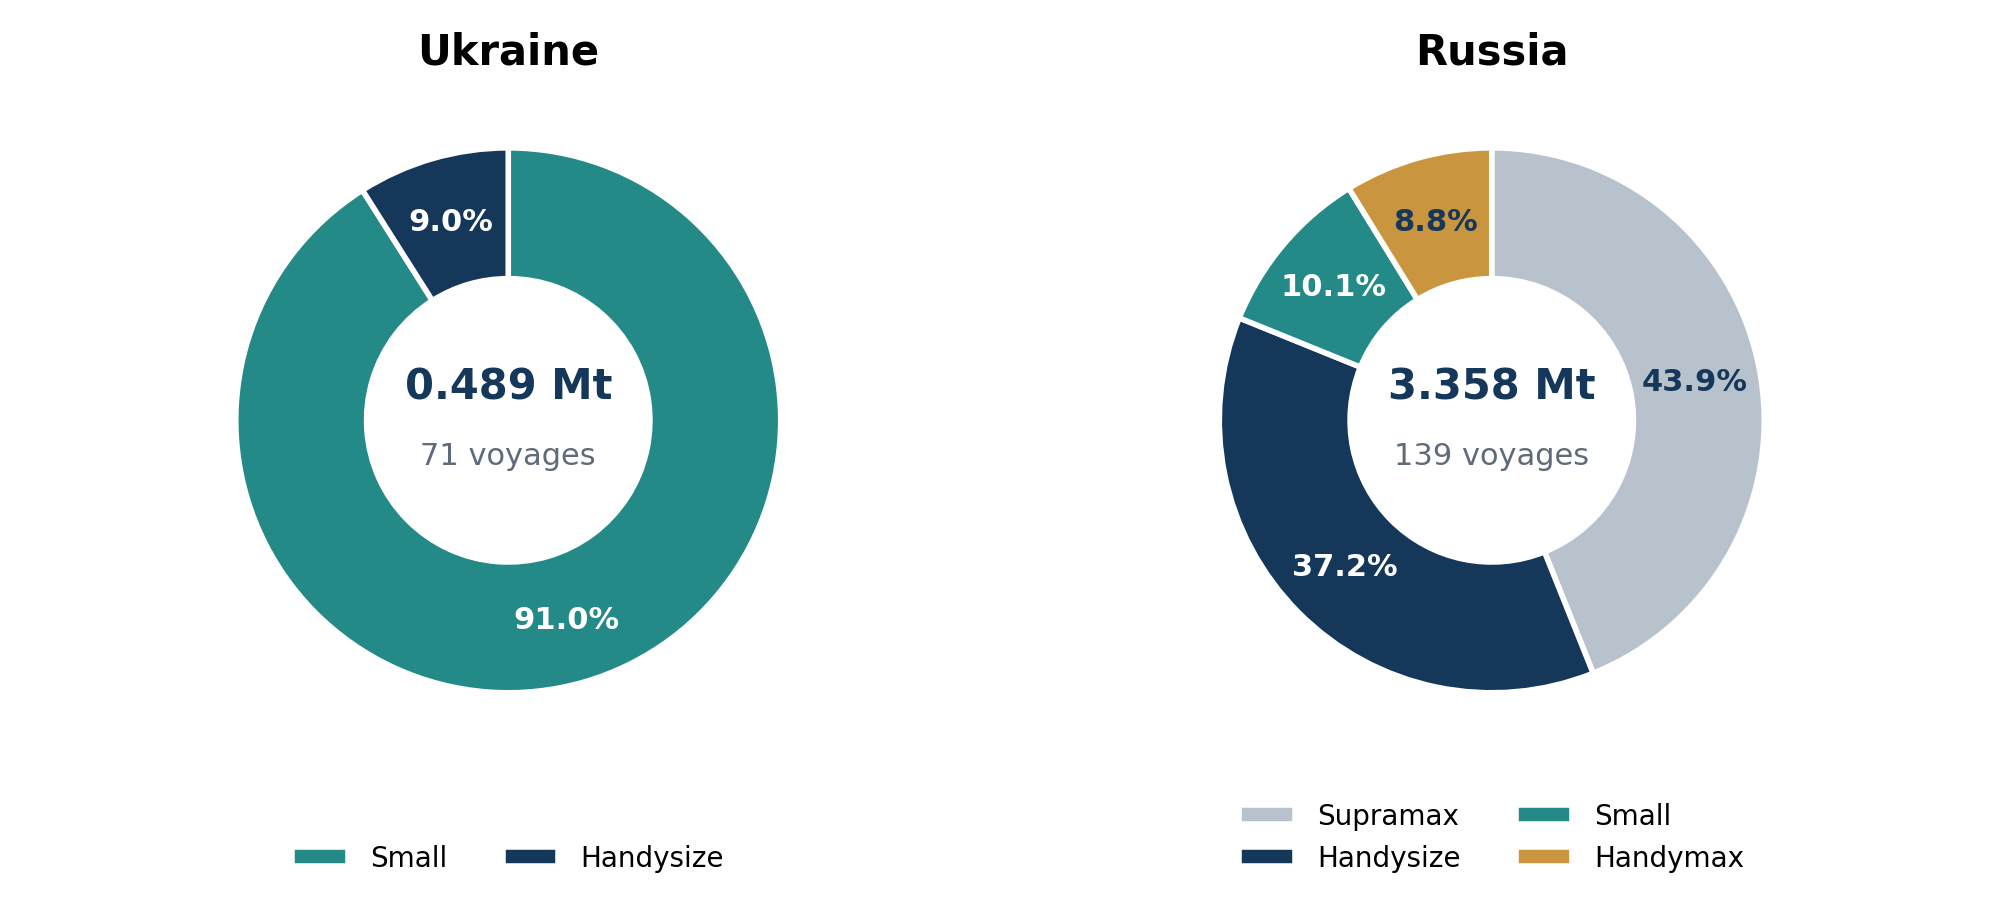
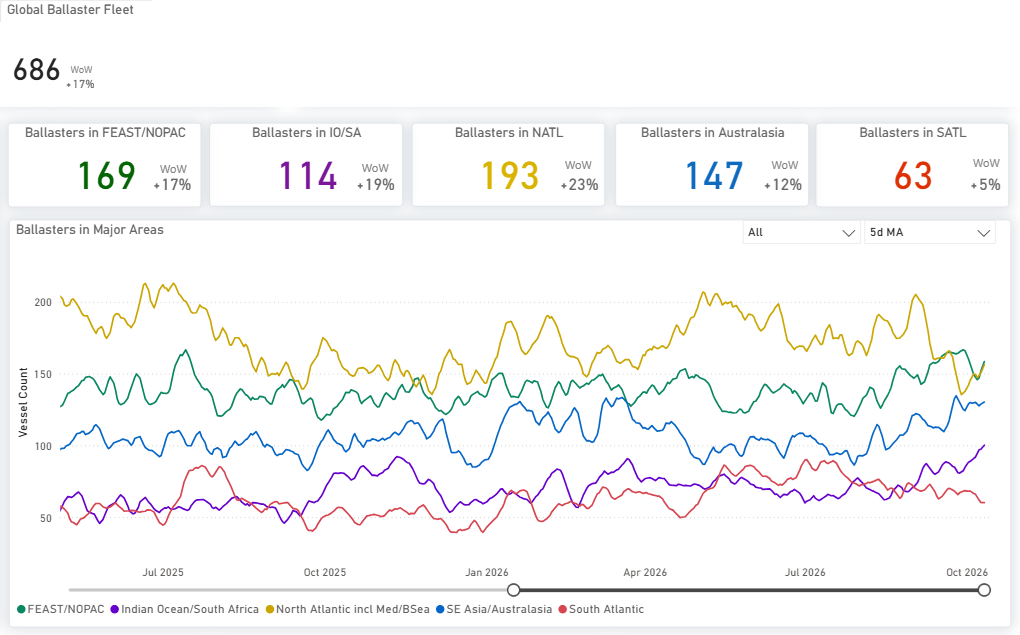
Smaller bulkers face fewer steel cargoes and higher Black Sea voyage risk. Small bulkers carried 91.0% of recorded Ukrainian steel tonnes in January–September, while Handysize accounted for 37.2% of Russian steel shipments, alongside Supramax at 43.9%. The reduction in Russian Handysize employment is substantial: recorded steel tonnage fell 53.4% to 1.25 Mt, with voyages declining from 109 to 49. Against a wider reference supply of 193 Handysize ballasters across the North Atlantic, Mediterranean and Black Sea, the loss of Black Sea cargoes adds to downward pressure on employment and freight for vessels seeking business in the region. Fewer steel sailings narrow loading opportunities for small bulkers and Handysize vessels, while attacks on merchant shipping and higher war-risk quotations increase the costs and risks of regional trading. These vessels face a shrinking steel cargo base within a security environment affecting Black Sea shipping across cargo types.
SUPPLY & DEMAND | WHAT CHANGED VS WEEK 40
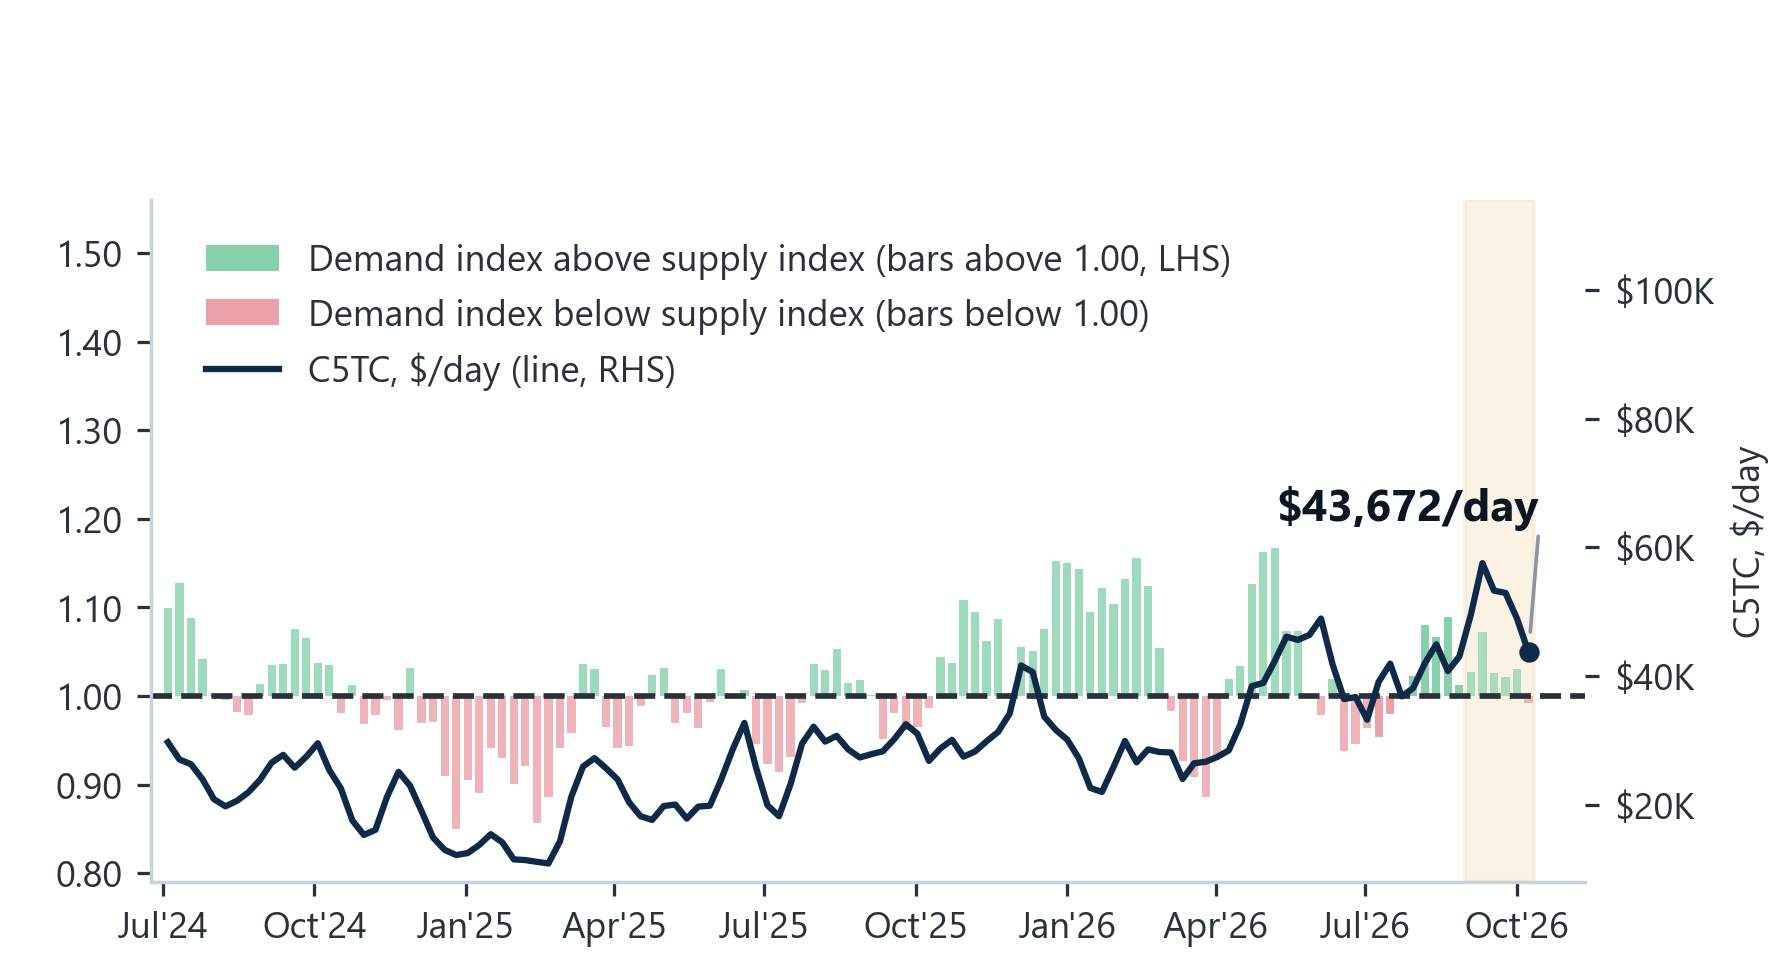
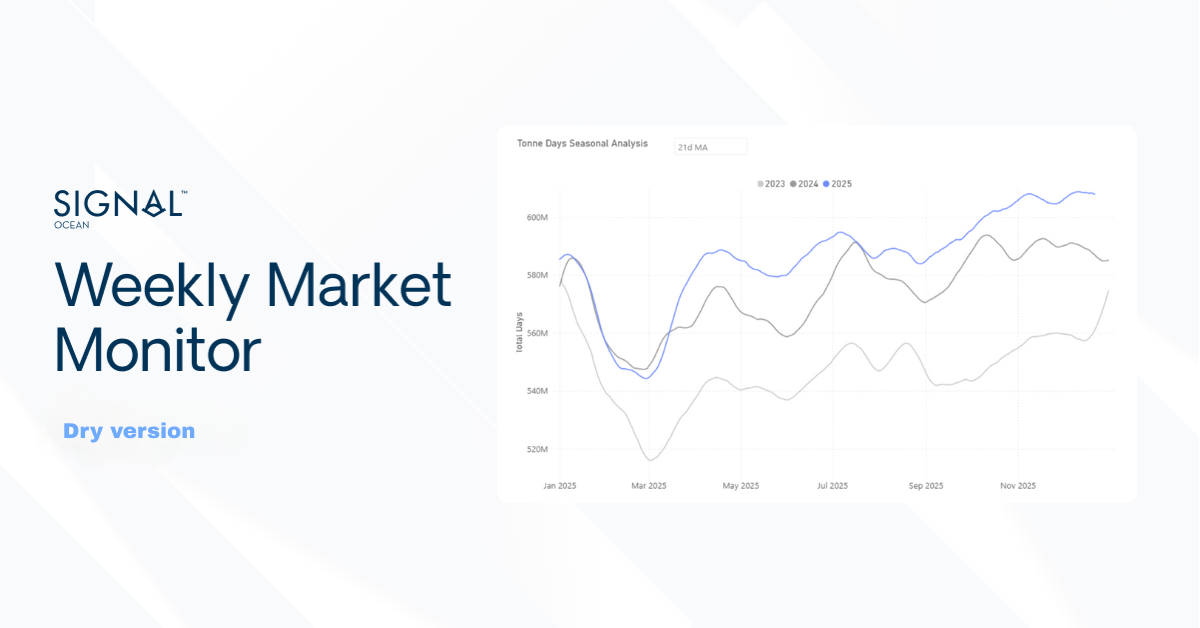
Ratios softened together; fundamentals split by basin. All 4 demand-to-supply (D/S) ratios eased by 0.01–0.02, and Capesize moved to 0.99 from 1.01, so demand growth now trails supply growth across all 4 segment indices. That does not mean demand is falling: Capesize demand is +0.1% y/y against supply +1.0%.
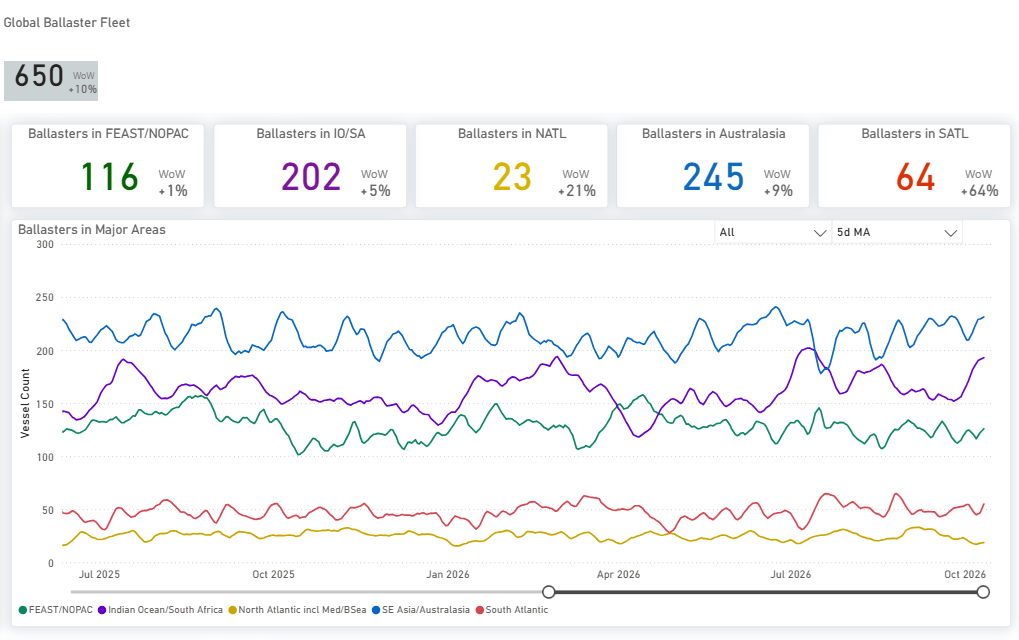
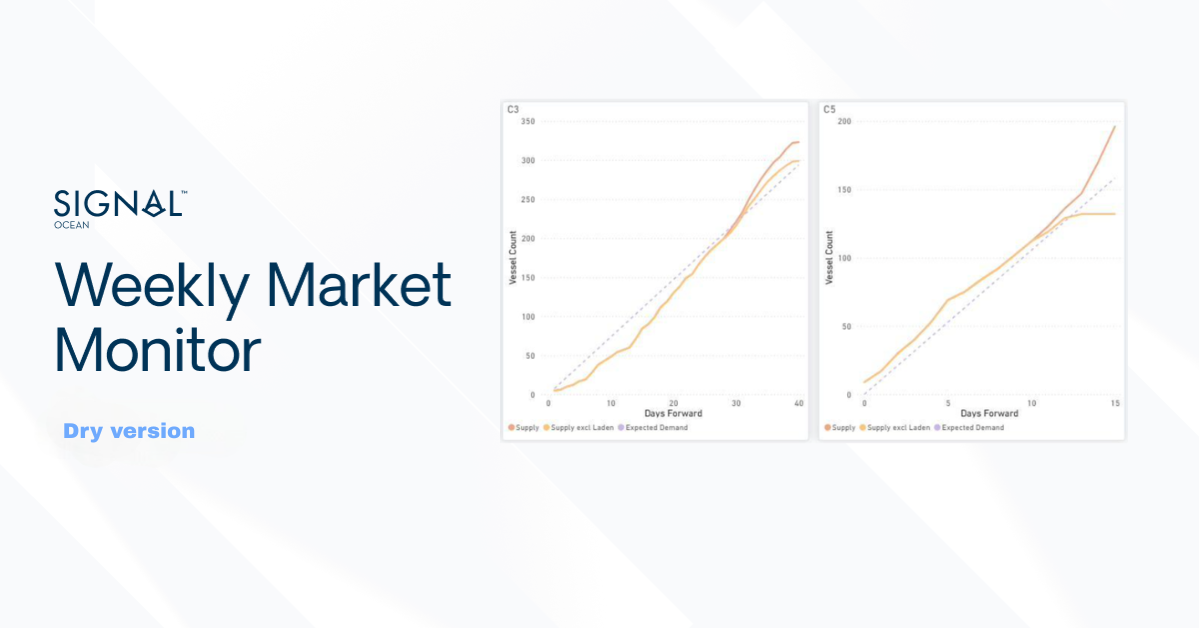
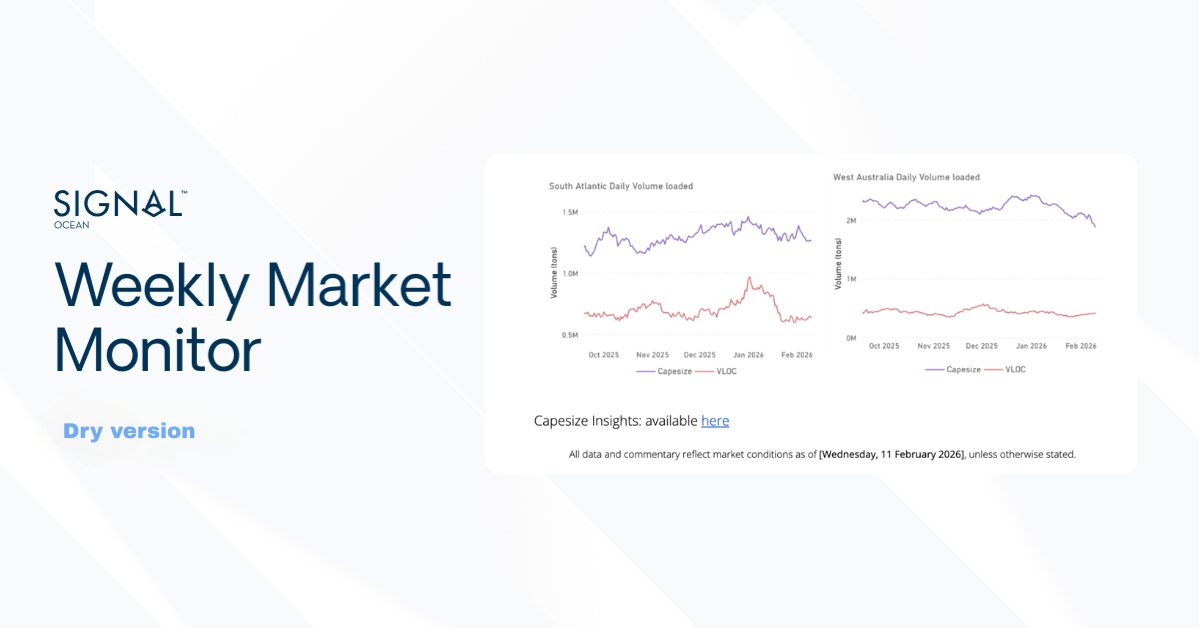
Rising vessel availability is weighing on Atlantic Capesize freight. South Atlantic ballasters increased to 64, compared with 48 in Week 40. On C3, forward vessel supply now exceeds expected demand from around day 16, compared with day 30 previously, bringing the supply surplus closer to the prompt loading window. C3 closed at $33.29/mt, down $4.36, reflecting the weaker Atlantic balance. In the Pacific, active C5 fixing was accompanied by a smaller rate decline of $0.19 to $14.24/mt, with forward supply remaining close to expected demand.
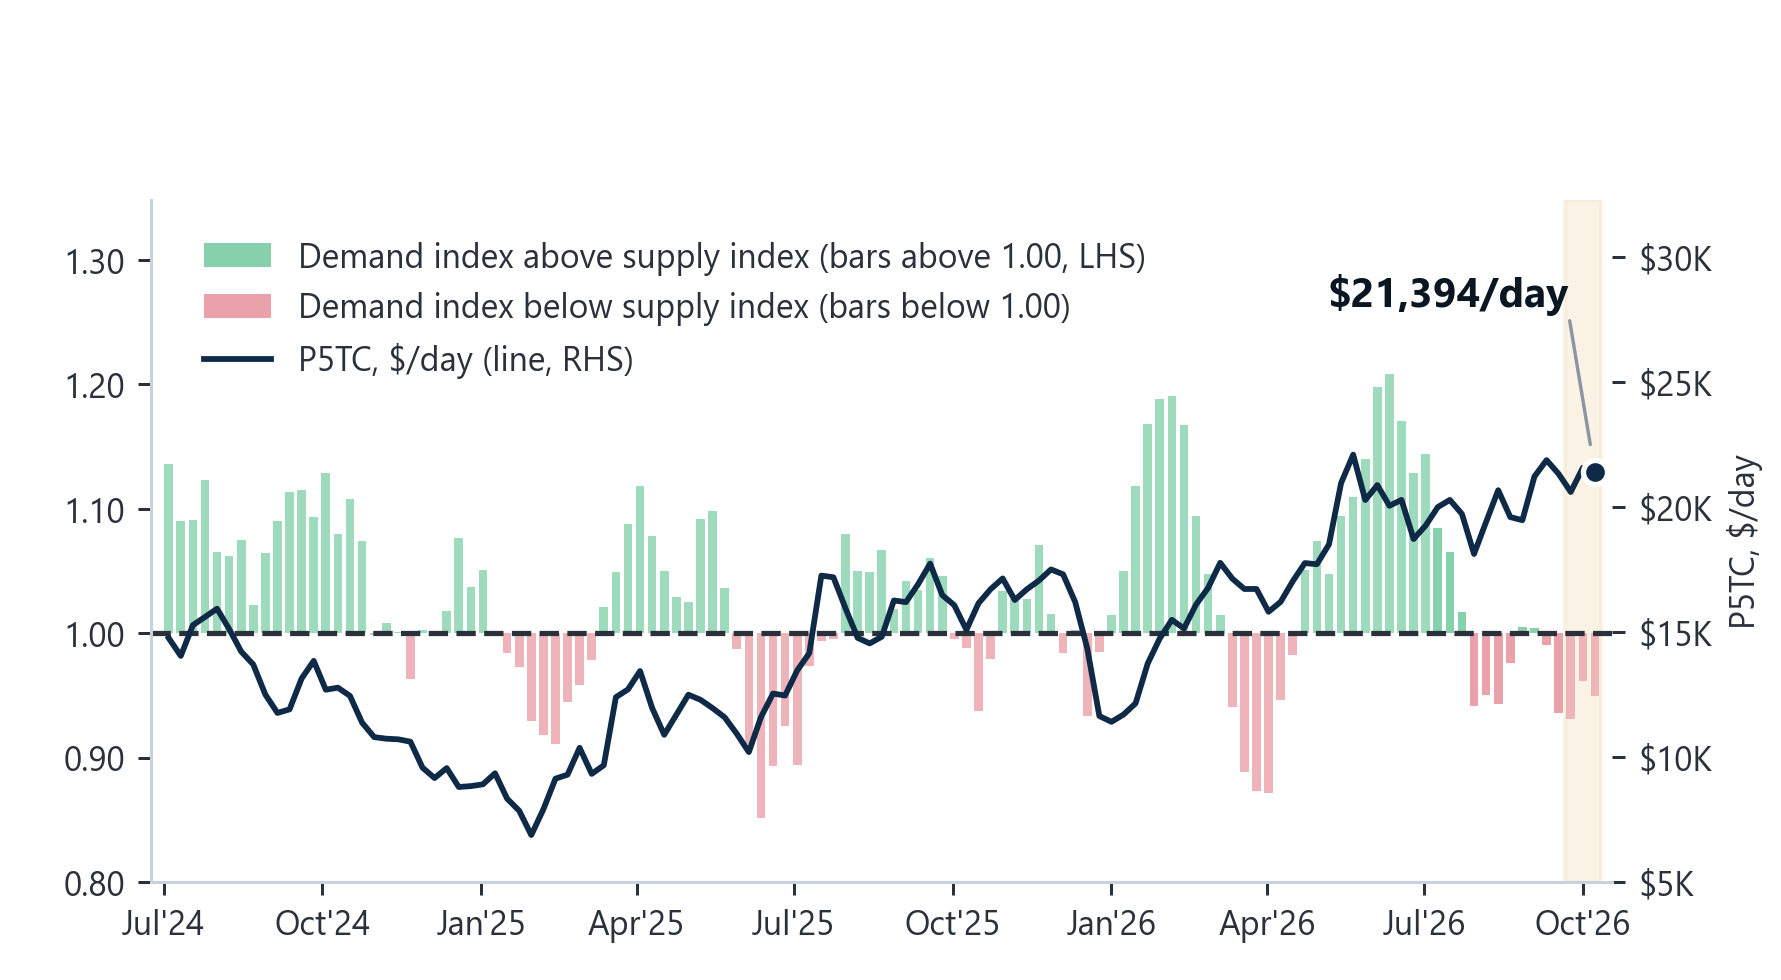
Panamax — Rates turn higher as forward supply tightens. In Week 40, firmer US Gulf demand failed to lift rates: all routes declined, and P5TC lost $313/day. In Week 41, the projected vessel shortfall widened: P3 moved from surplus to deficit, while P6 supply fell below expected demand from day 3, compared with day 5 last week. Activity increased across both basins, with transatlantic demand absorbing available tonnage. All routes gained, taking P5TC up $464 to $21,813/day, as the tighter forward balance was reflected in rates.
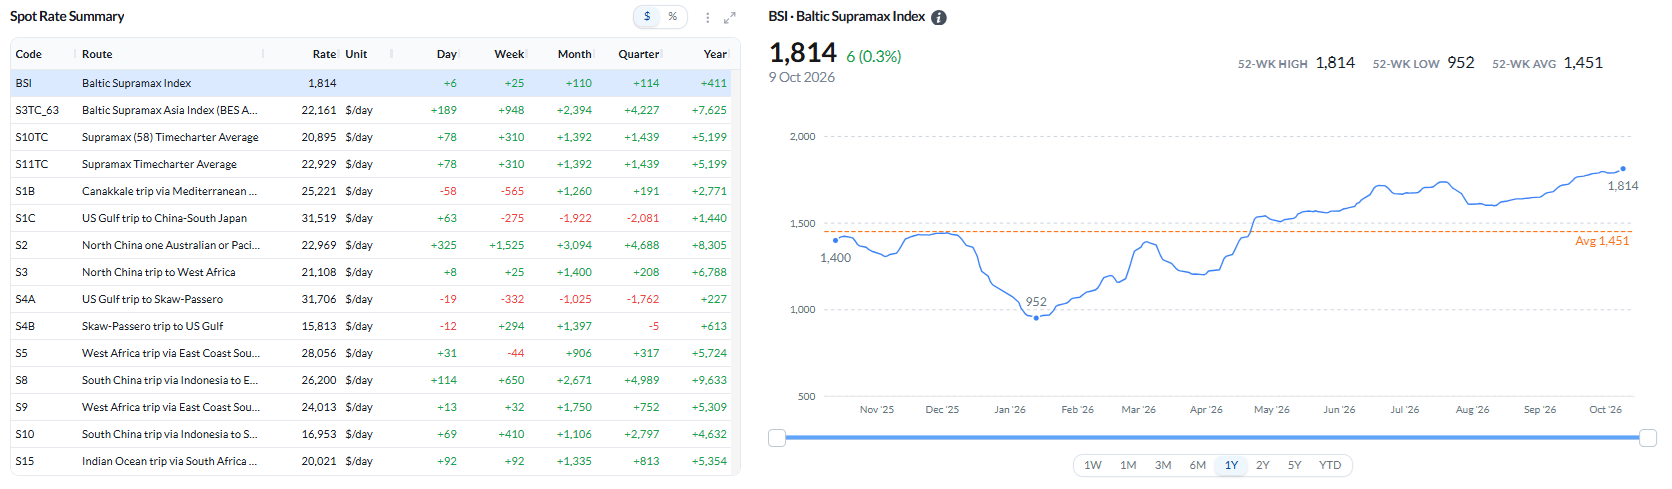
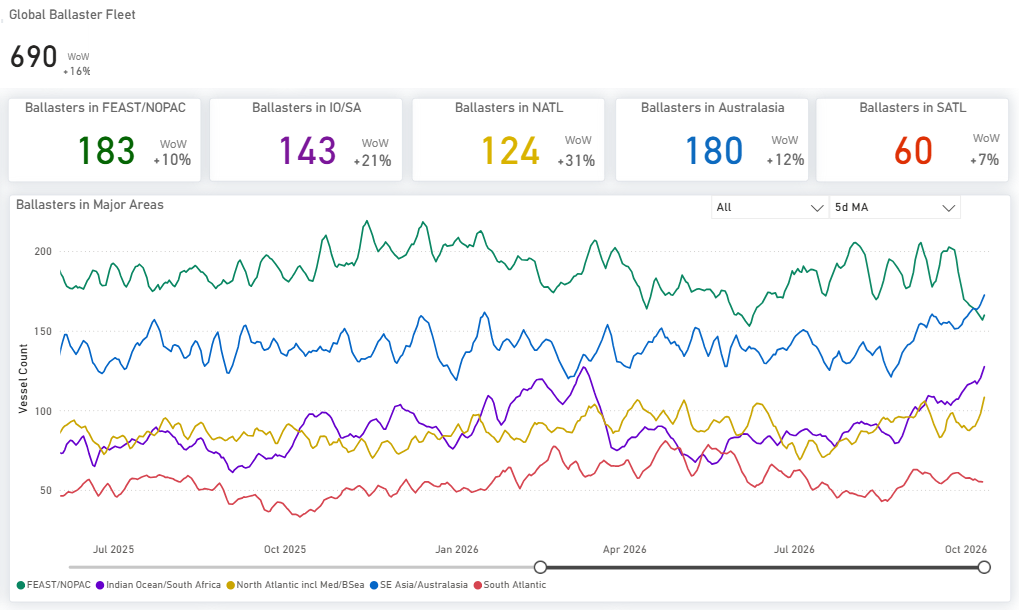
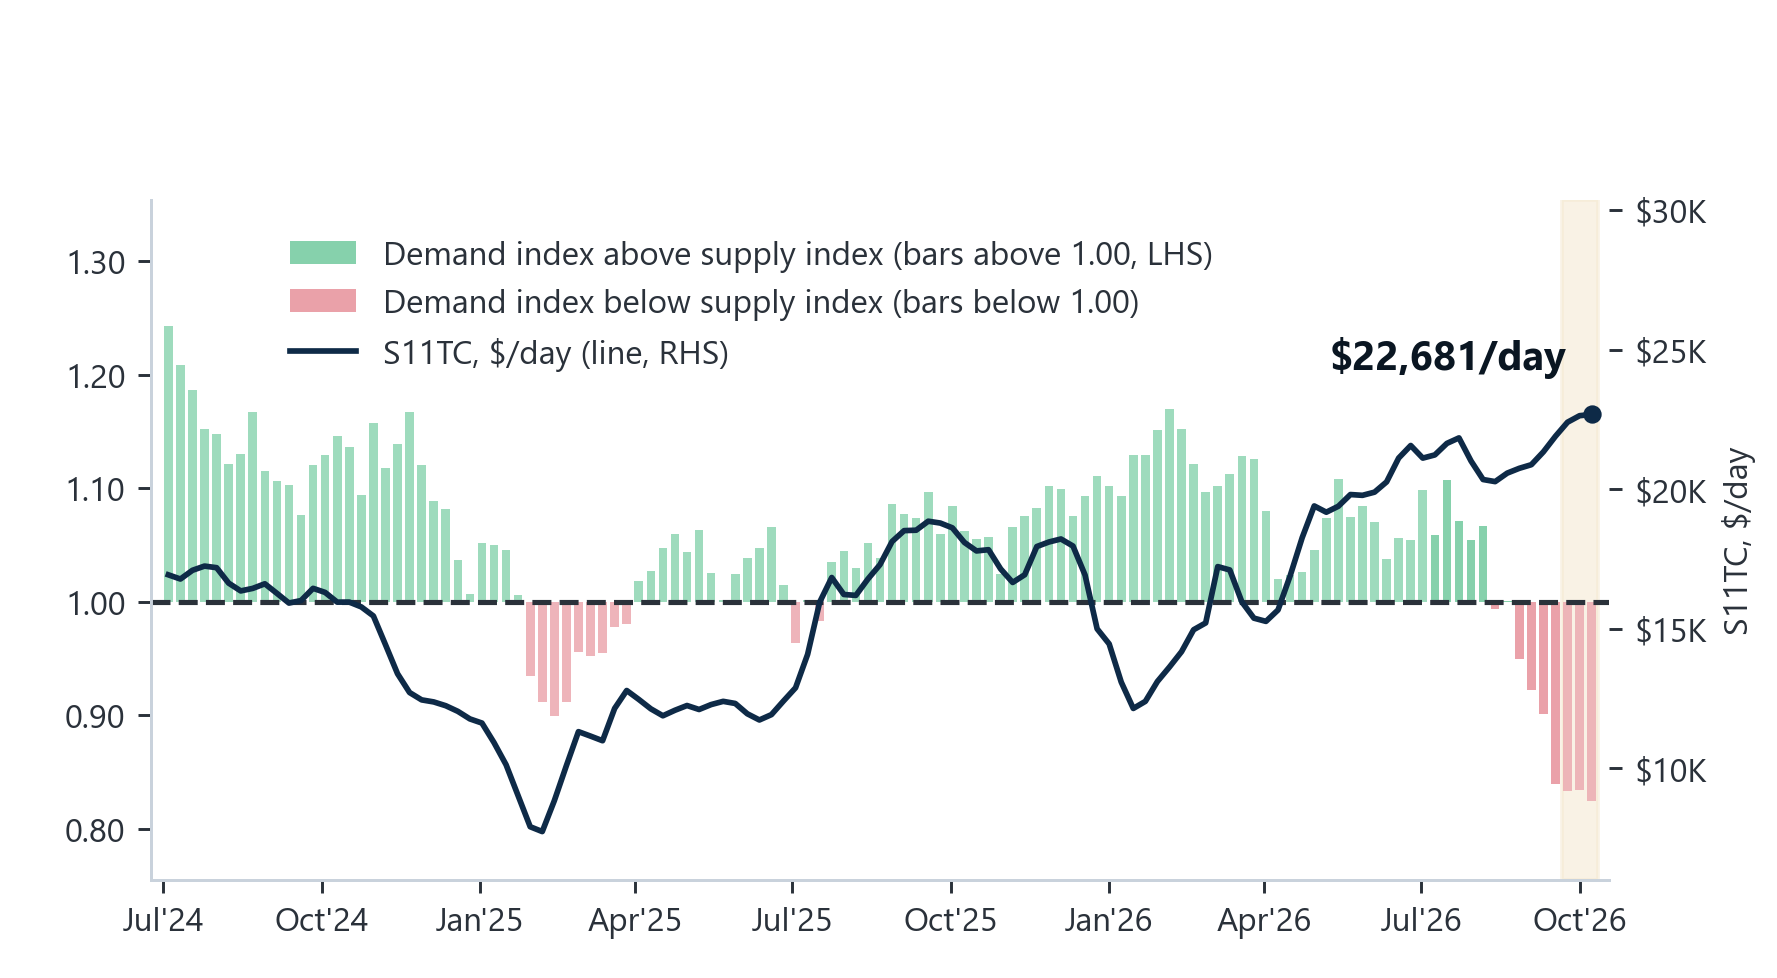
Supramax — Asian gains offset Atlantic weakness. In Week 40, vessel supply covered expected demand across all four forward cases. In Week 41, S8 and S10 in Asia moved into deficit, while US Gulf supply remained above expected demand and North Atlantic ballasters increased to 124, from 103 in Week 40. Rates reflected this regional divergence: S2 gained $1,525/day, and S8 rose $650/day, while S1C fell $275/day as US Gulf fronthaul earnings slipped below transatlantic levels. Asian strength helped lift the BSI to a 52-week high of 1,814, despite an overall D/S ratio of 0.82.
Handysize — US Gulf weakens as South Atlantic gains ground. In Week 40, strength centred on the Continent. In Week 41, subdued US Gulf demand and ample vessel availability pushed HS4_38 down $2,671 to $21,436/day, while North Atlantic ballasters increased to 193, from 174 in Week 40. The South Atlantic strengthened, with healthy cargo enquiry and tighter tonnage, lifting HS3_38 by $1,006 to $26,600/day. In the Pacific, the forward balance was mixed: HS6 moved from a projected vessel deficit to a surplus, while HS7 remained in deficit.
FREIGHT MARKET OVERVIEW

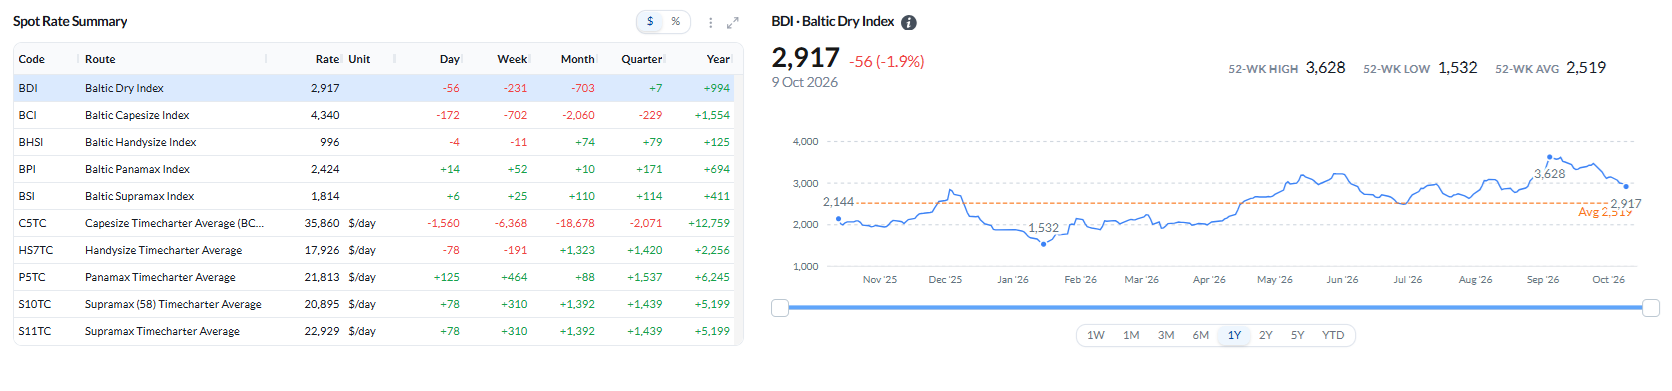
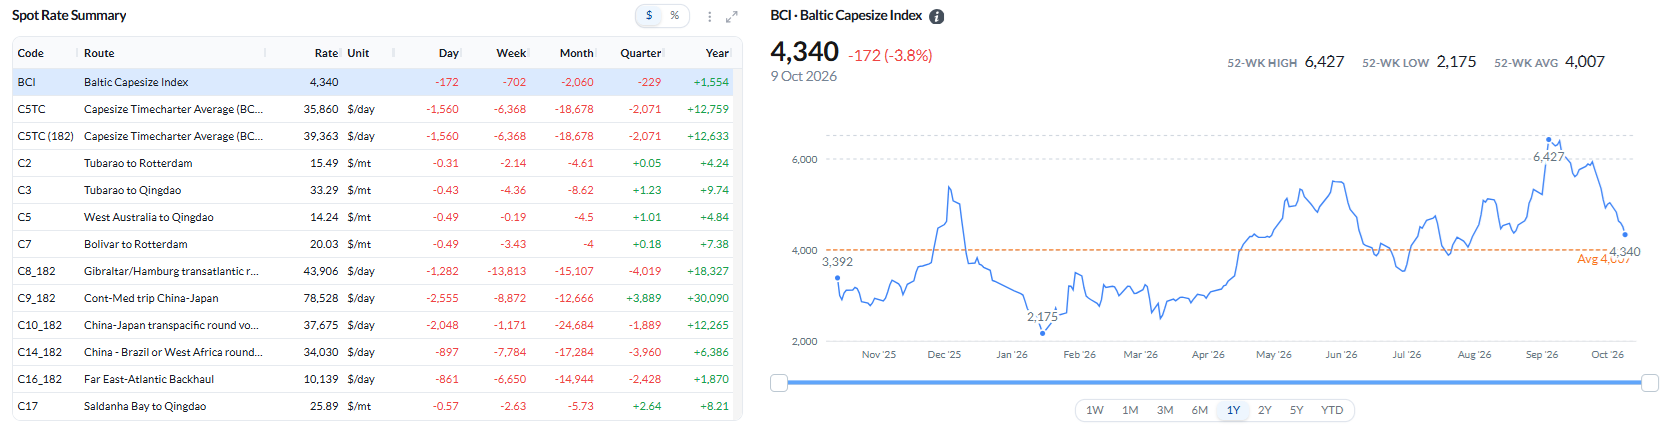
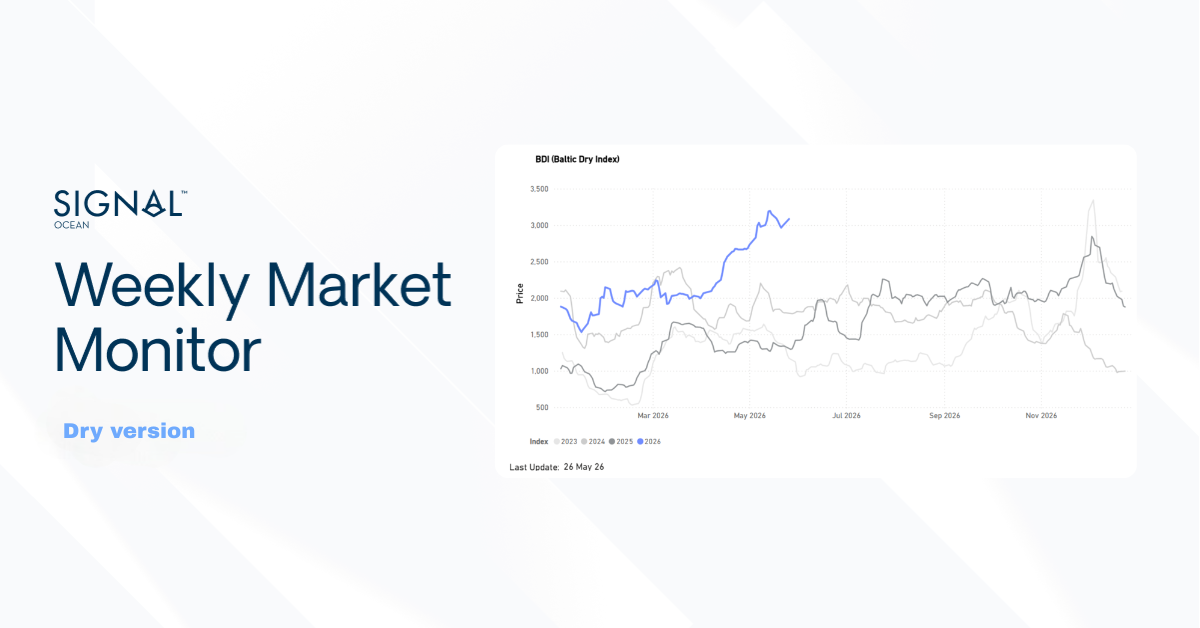
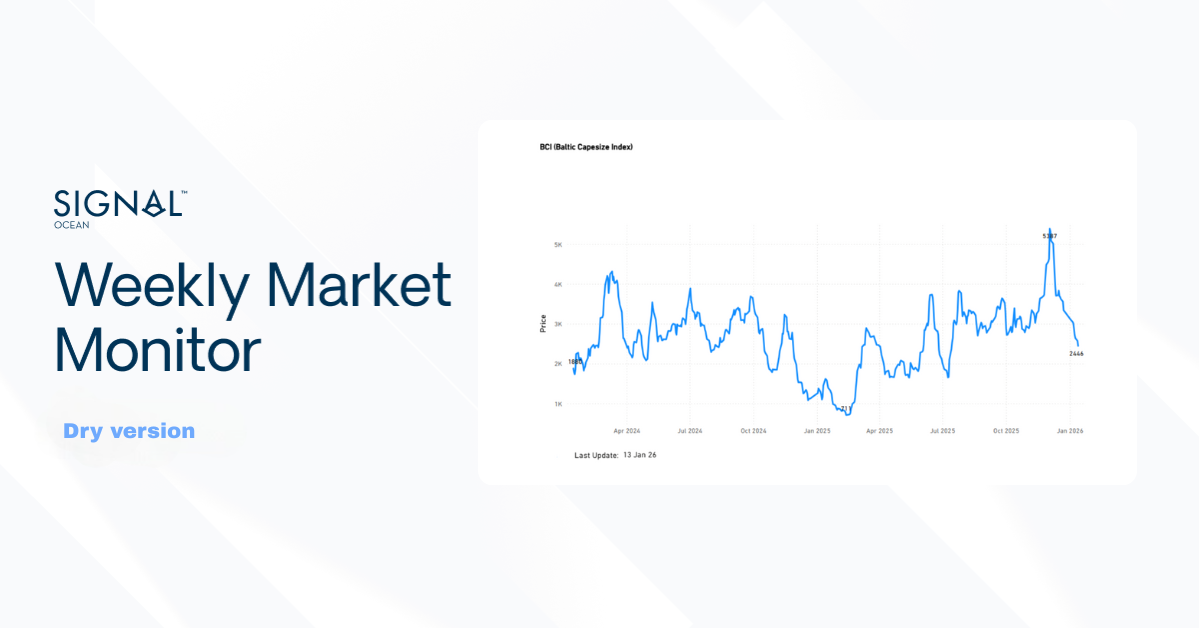
The BDI fell 231 points to 2,917, its 2nd weekly decline, as the BCI lost 702 points. C5TC(182) closed at $39,363/day and C5TC(180) at $35,860/day; the $3,503 gap is the Baltic Exchange’s prescribed adjustment between the 2 benchmark vessels, not a market spread. The BPI (+52) and BSI (+25, a 52-week high at 1,814) offset part of the fall.
Ballasters, 9 Oct

CAPESIZE
Freight. The BCI fell 702 points to 4,340, C5TC(180) $6,368 to $35,860/day, and C5TC(182) to $39,363/day. All routes fell, led by the Atlantic: C8_182 −$13,813 to $43,906/day, C14_182 −$7,784 to $34,030/day, C16_182 −$6,650 to $10,139/day, and C3 −$4.36 to $33.29/mt. The Pacific held: C10_182 −$1,171 to $37,675/day and C5 −$0.19 to $14.24/mt. C9_182 remains the top route at $78,528/day.
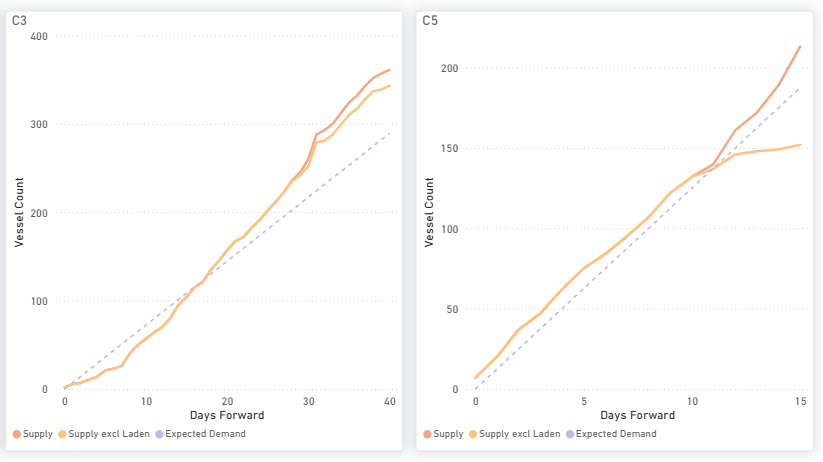
Forward balance. C3 supply runs below expected demand to about day 16, then ends near 360 vessels against 290 by day 40 (excluding laden, about 345). C5 supply sits at or just above expected demand, reaching about 213 against 187 by day 15, while supply excluding laden vessels flattens from day 12 to about 152. Tonne-mile demand is provisionally 0.1% above a year ago while available tonnage is 1.0% higher, leaving the D/S ratio at 0.99.
PANAMAX
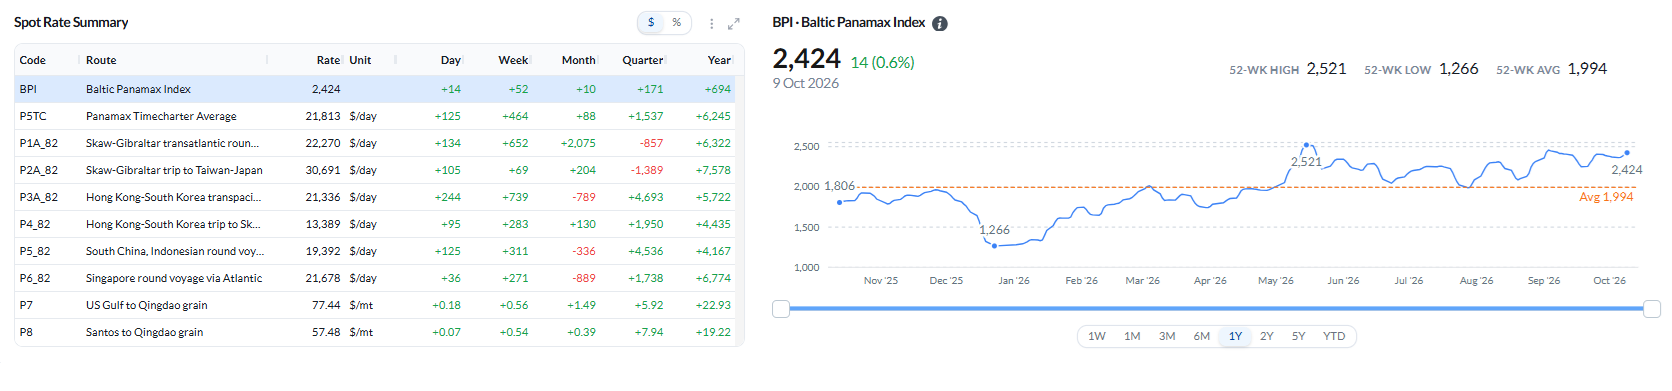
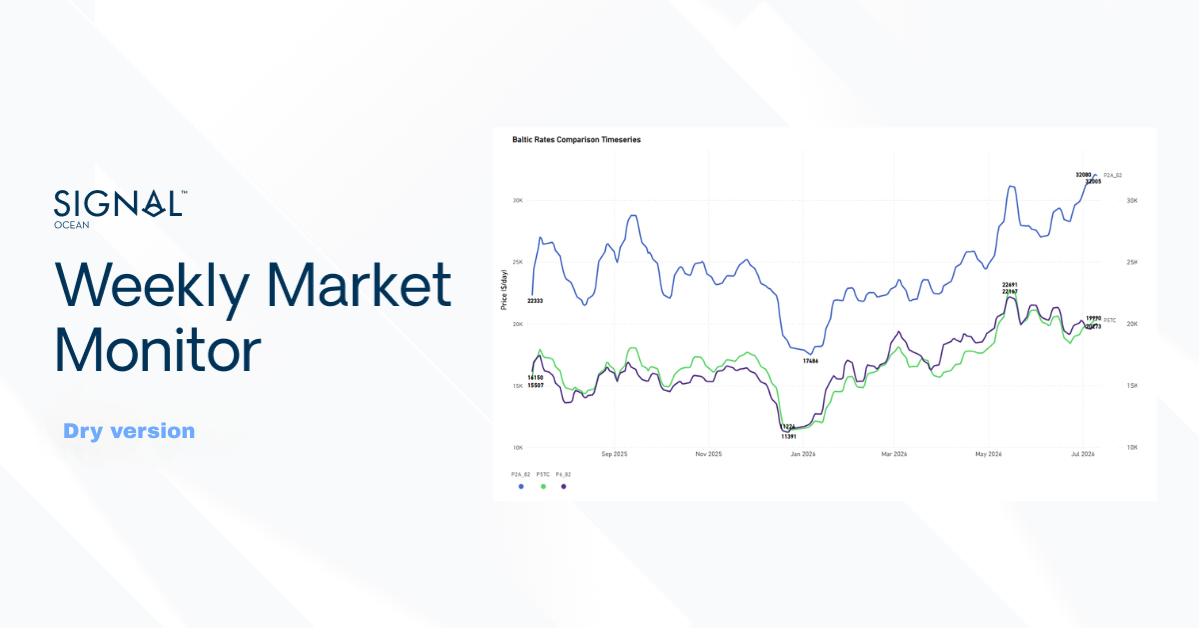
Freight. The BPI rose 52 points to 2,424 and P5TC $464 to $21,813/day, with all routes higher. P3A_82 led, +$739 to $21,336/day, followed by P1A_82 (+$652 to $22,270/day) and P5_82 (+$311 to $19,392/day); P2A_82 remains the top route at $30,691/day. P7 and P8 firmed to $77.44/mt (+$0.56) and $57.48/mt (+$0.54).
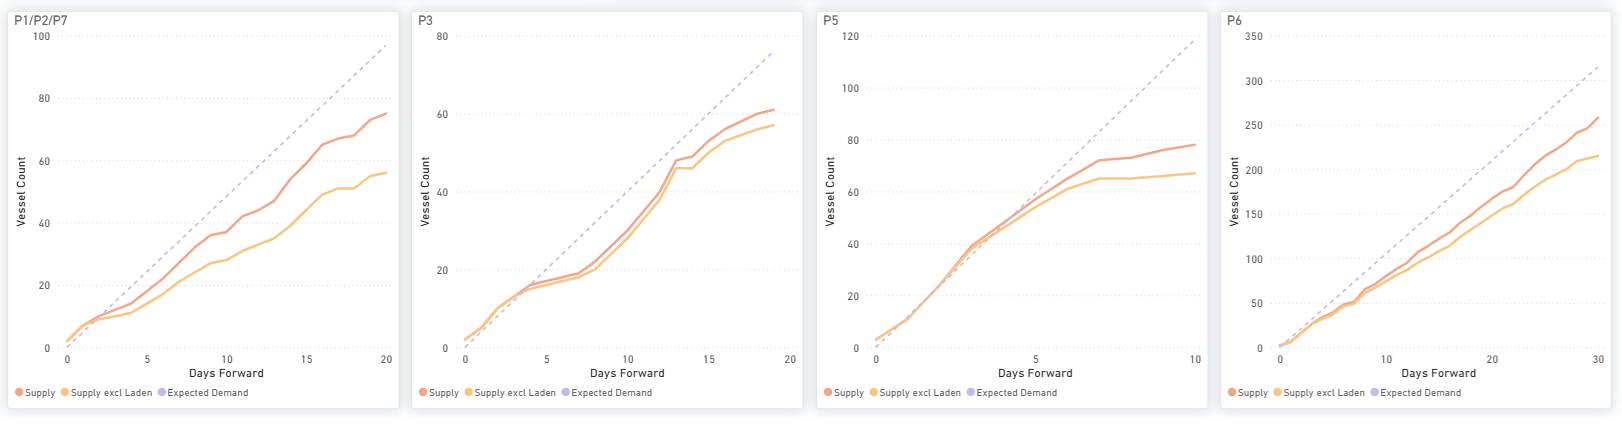
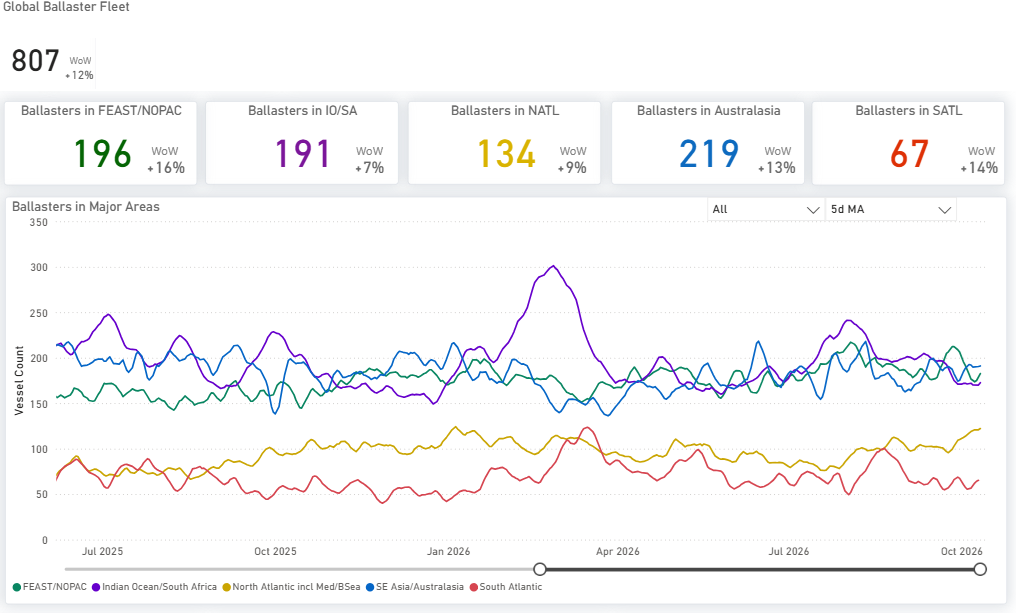
Forward balance. Supply ends short of expected demand on all 4 panels: P1/P2/P7 about 75 against 97 at day 20, P3 61 against 76, P5 78 against 118 at day 10, and P6 258 against 315 at day 30, despite 807 ballasters globally (+27 vs the Week 40 count). Tonne-mile demand is provisionally 7.2% below a year ago while available tonnage is 2.2% lower, leaving the D/S ratio at 0.95.
SUPRAMAX
Freight. The BSI rose 25 points to a 52-week high of 1,814 and S11TC $310 to $22,929/day, with S3TC_63 +$948. Asia led: S2 +$1,525 to $22,969/day, S8 +$650 to $26,200/day and S10 +$410 to $16,953/day. The US Gulf eased: S4A −$332 to $31,706/day (still the top route) and S1C −$275 to $31,519/day; S1B −$565 to $25,221/day.
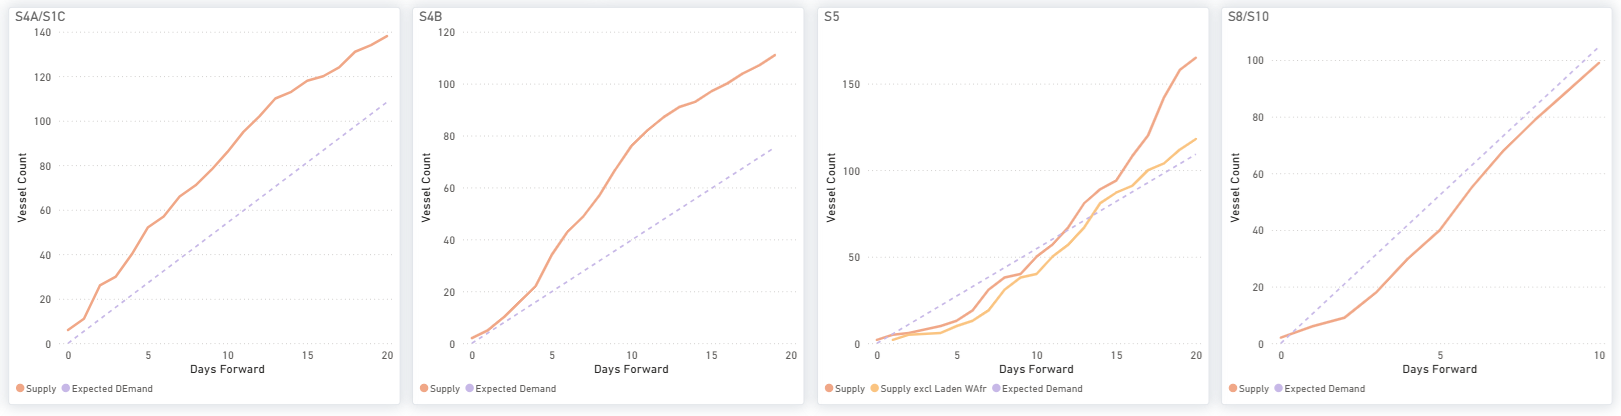
Forward balance. S4A/S1C (138 against 108) and S4B (111 against 75) stay well supplied by day 20. S5 runs short to about day 12 before ending at 165 against 110, and S8/S10 is short throughout, about 99 against 104 at day 10. Tonne-mile demand is provisionally 13.0% below a year ago while available tonnage is 5.5% higher, leaving the D/S ratio at 0.82.
HANDYSIZE
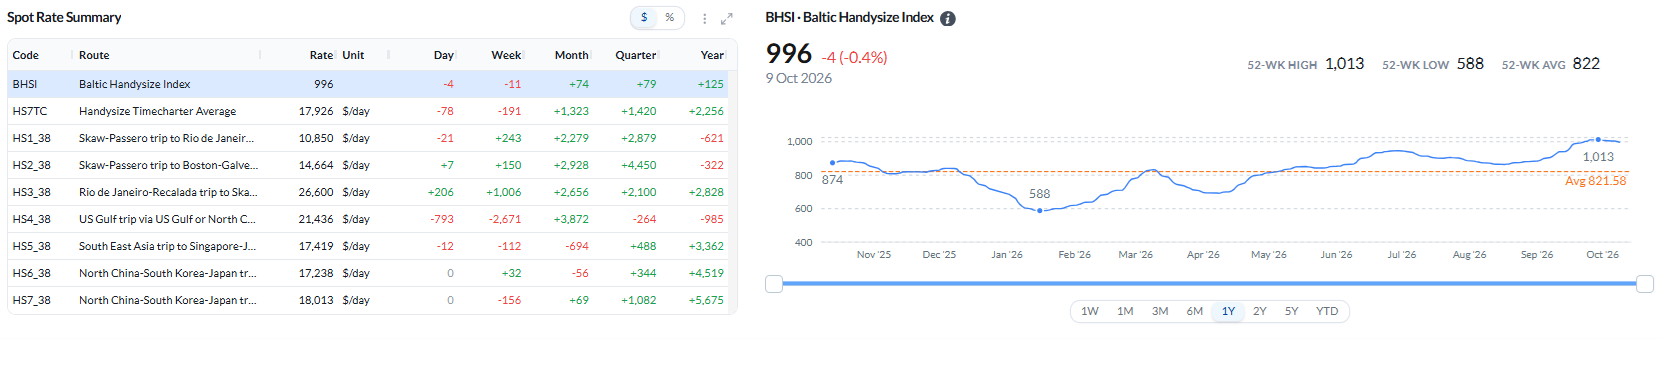
Freight. The BHSI slipped 11 points to 996 and HS7TC $191 to $17,926/day. The Atlantic split: HS4_38 (US Gulf) fell $2,671 to $21,436/day while HS3_38 (South Atlantic to Skaw) rose $1,006 to $26,600/day, now the top route. Continent routes edged up (HS1_38 +$243, HS2_38 +$150); Asia eased (HS7_38 −$156, HS5_38 −$112).
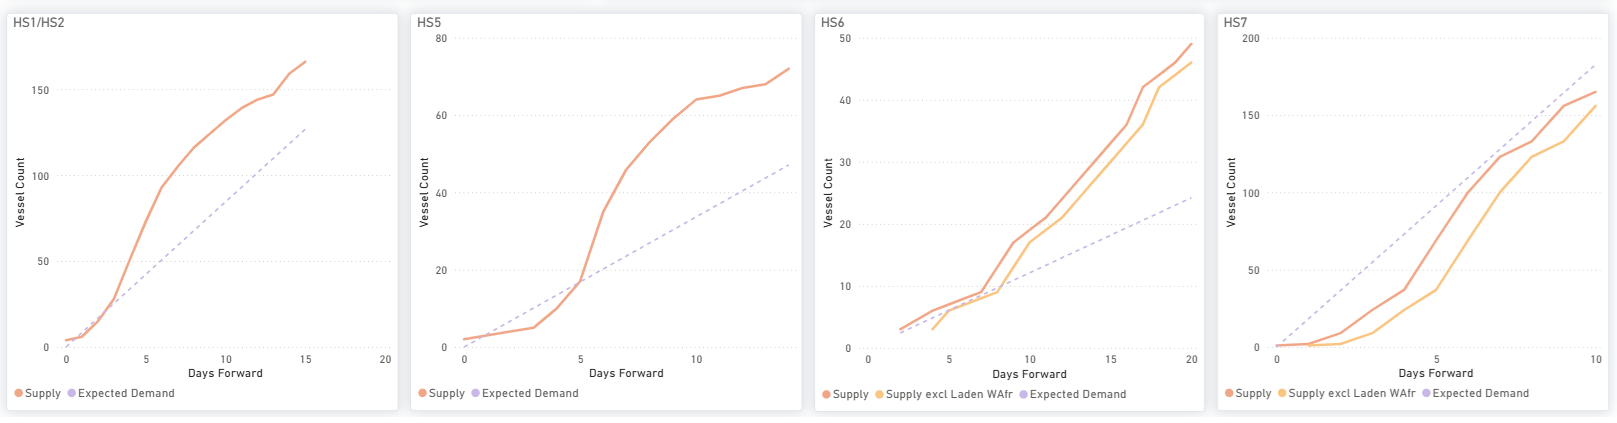
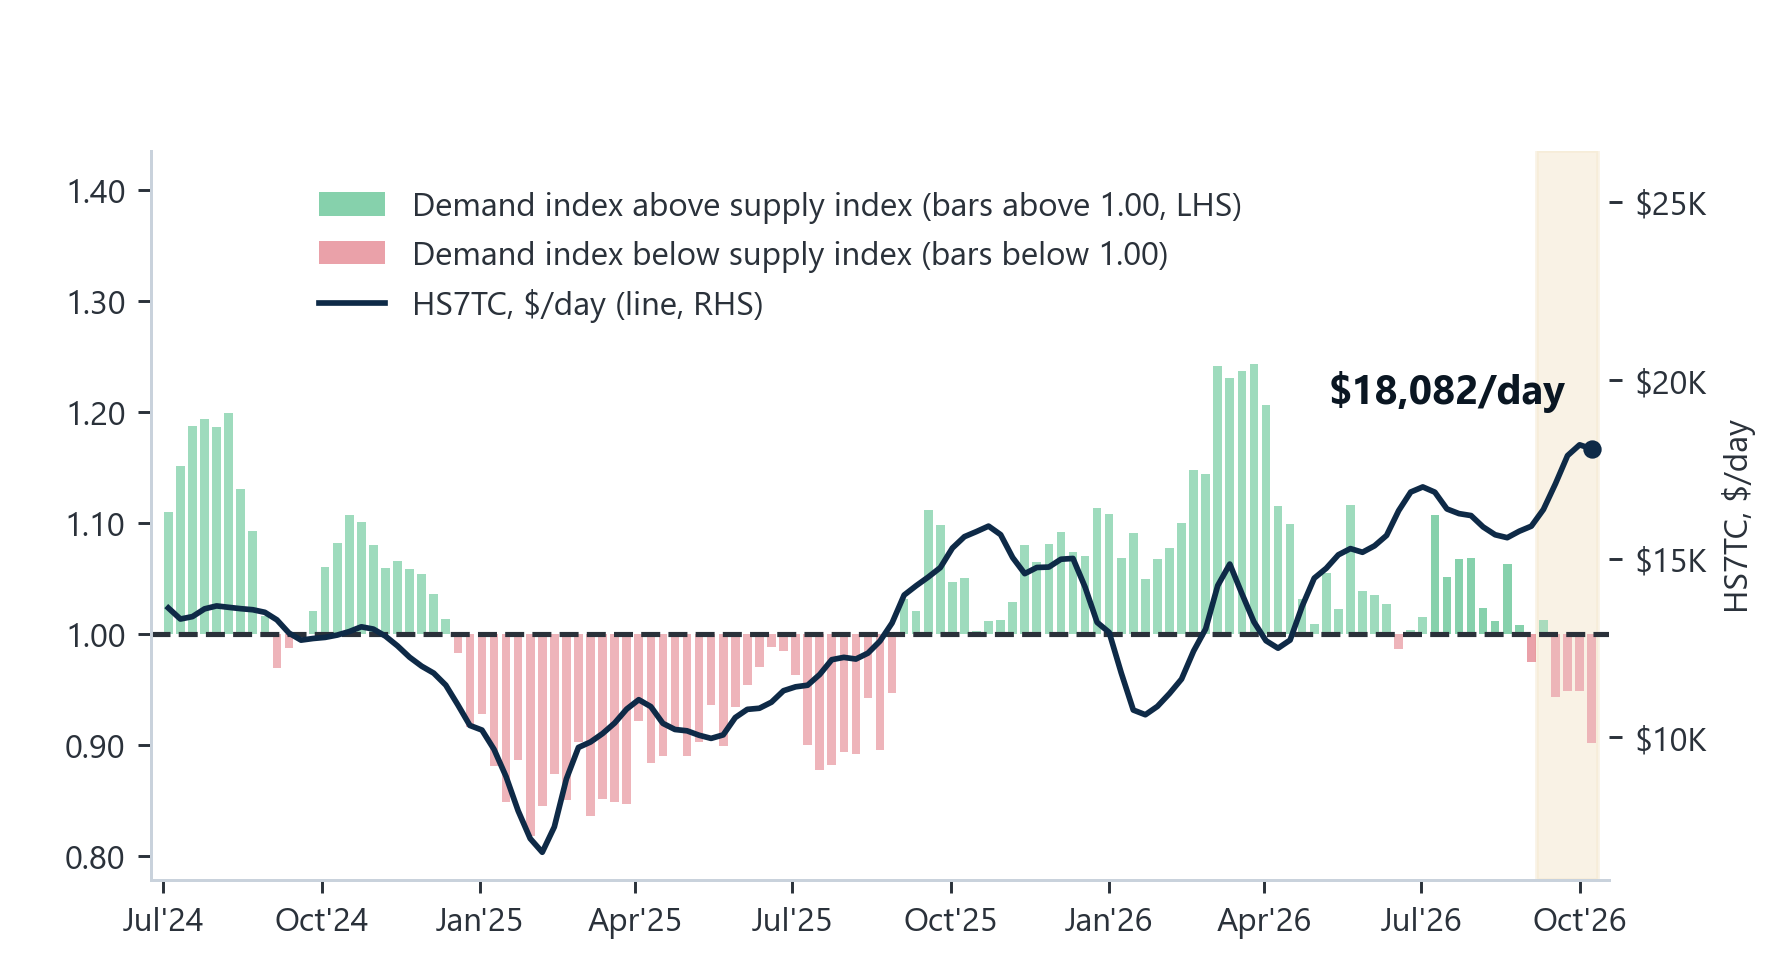
Forward balance. HS1/HS2 (167 against 128 at day 15), HS5 (72 against 47), and HS6 (49 against 24 at day 20) all end above expected demand. HS7 is the only displayed panel short throughout, about 165 against 183 at day 10. Tonne-mile demand is 17.7% below a year ago while available tonnage is 8.7% lower, leaving the D/S ratio at 0.90.
KEY TAKEAWAY
Capesize led the downward freight correction in Week 41, while its D/S ratio fell from 1.01 to 0.99, leaving all four segments below 1.00. Demand growth trailed supply growth across the four segment indices, and rising vessel availability added pressure: South Atlantic Capesize ballasters reached 64, while North Atlantic Supramax and Handysize counts increased to 124 and 193, respectively. Freight gains remained concentrated in routes with tighter availability: Panamax and Asian Supramax strengthened as forward supply fell short of expected demand, while South Atlantic Handysize benefited from stronger cargo enquiry and fewer available vessels.
The loss of Black Sea steel cargoes adds to the pressure on smaller bulkers. Small bulkers carried 90% of Ukrainian steel tonnes, while Supramax and Handysize handled 43.9% and 37.2% of Russian steel shipments, respectively, in January–September. Ukrainian mill stoppages and uncertainty over restarting Kryvyi Rih constrain the prospect of a near-term cargo recovery. Fewer cargo opportunities risk intensifying competition for employment as geared vessel availability rises, although the steel contraction’s contribution to the larger ballaster pool cannot be isolated. Attacks on shipping and higher war-risk premiums also raise the cost of the remaining Black Sea voyages.



Ready to get started and outrun your competition?
.png)

.png)











.png)






.png)
.png)


.png)