Back to Weekly Market Monitors

Weekly Tanker Market Monitor: Week 41 2026

Tankers
October 16, 2026

SPOTLIGHT OF THE WEEK- Faster Ballast, Slower Laden: VLCC Supply Signals Diverge

This week’s Tanker Market Monitor examines divergence in VLCC sailing speeds, regional vessel supply, and freight earnings. In the Arabian Gulf, ballast vessels are accelerating while laden ships are slowing, with no clear improvement in overall voyage turnaround. Meanwhile, the western VLCC ballast surplus has narrowed, in contrast to rising ballast numbers East of Suez. Despite this increase in eastern vessel supply, Gulf VLCC earnings remain exceptionally high, and dirty-tanker freight continues to outperform the clean market by a substantial margin. The findings highlight why faster repositioning and higher ballast counts have yet to translate into meaningful freight relief.
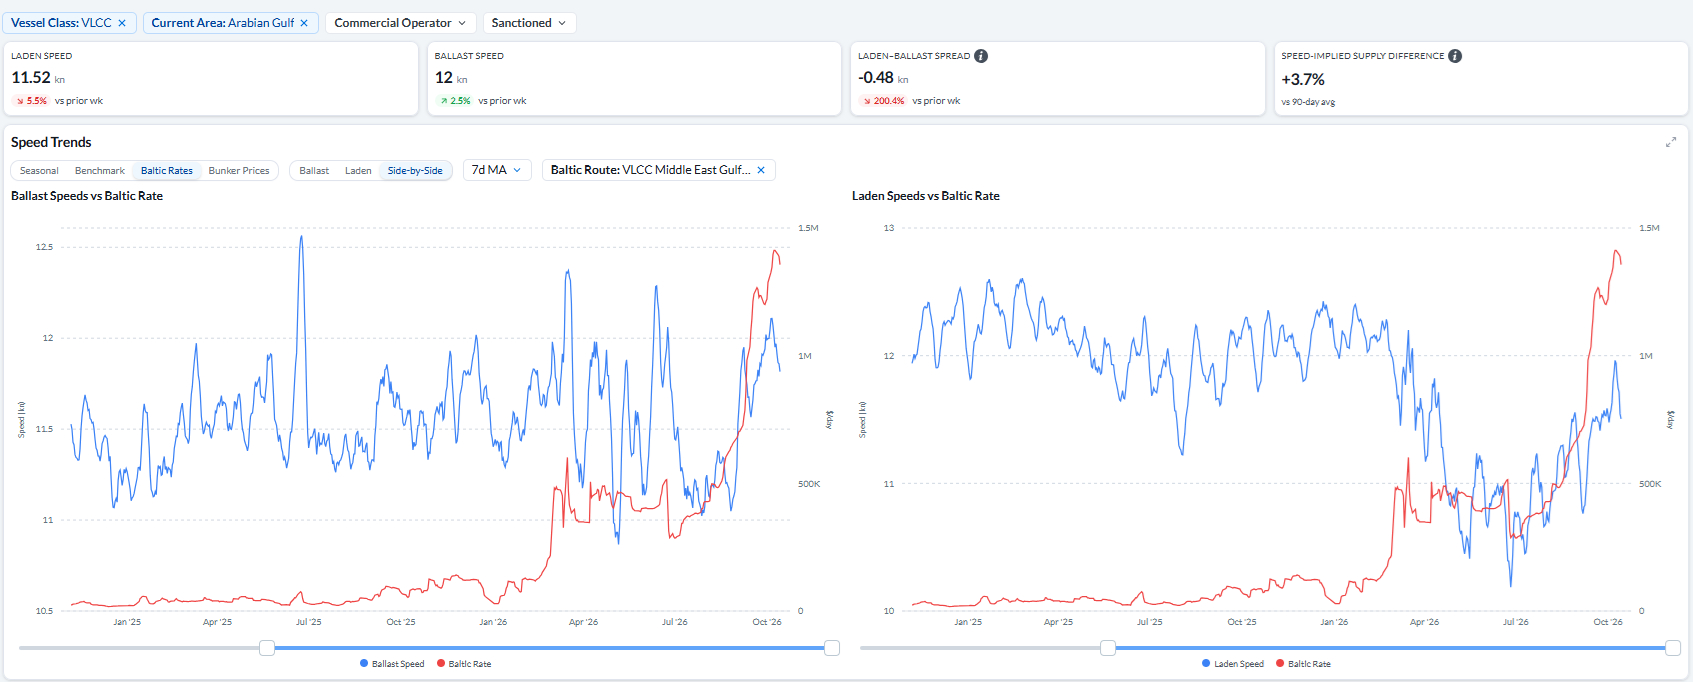
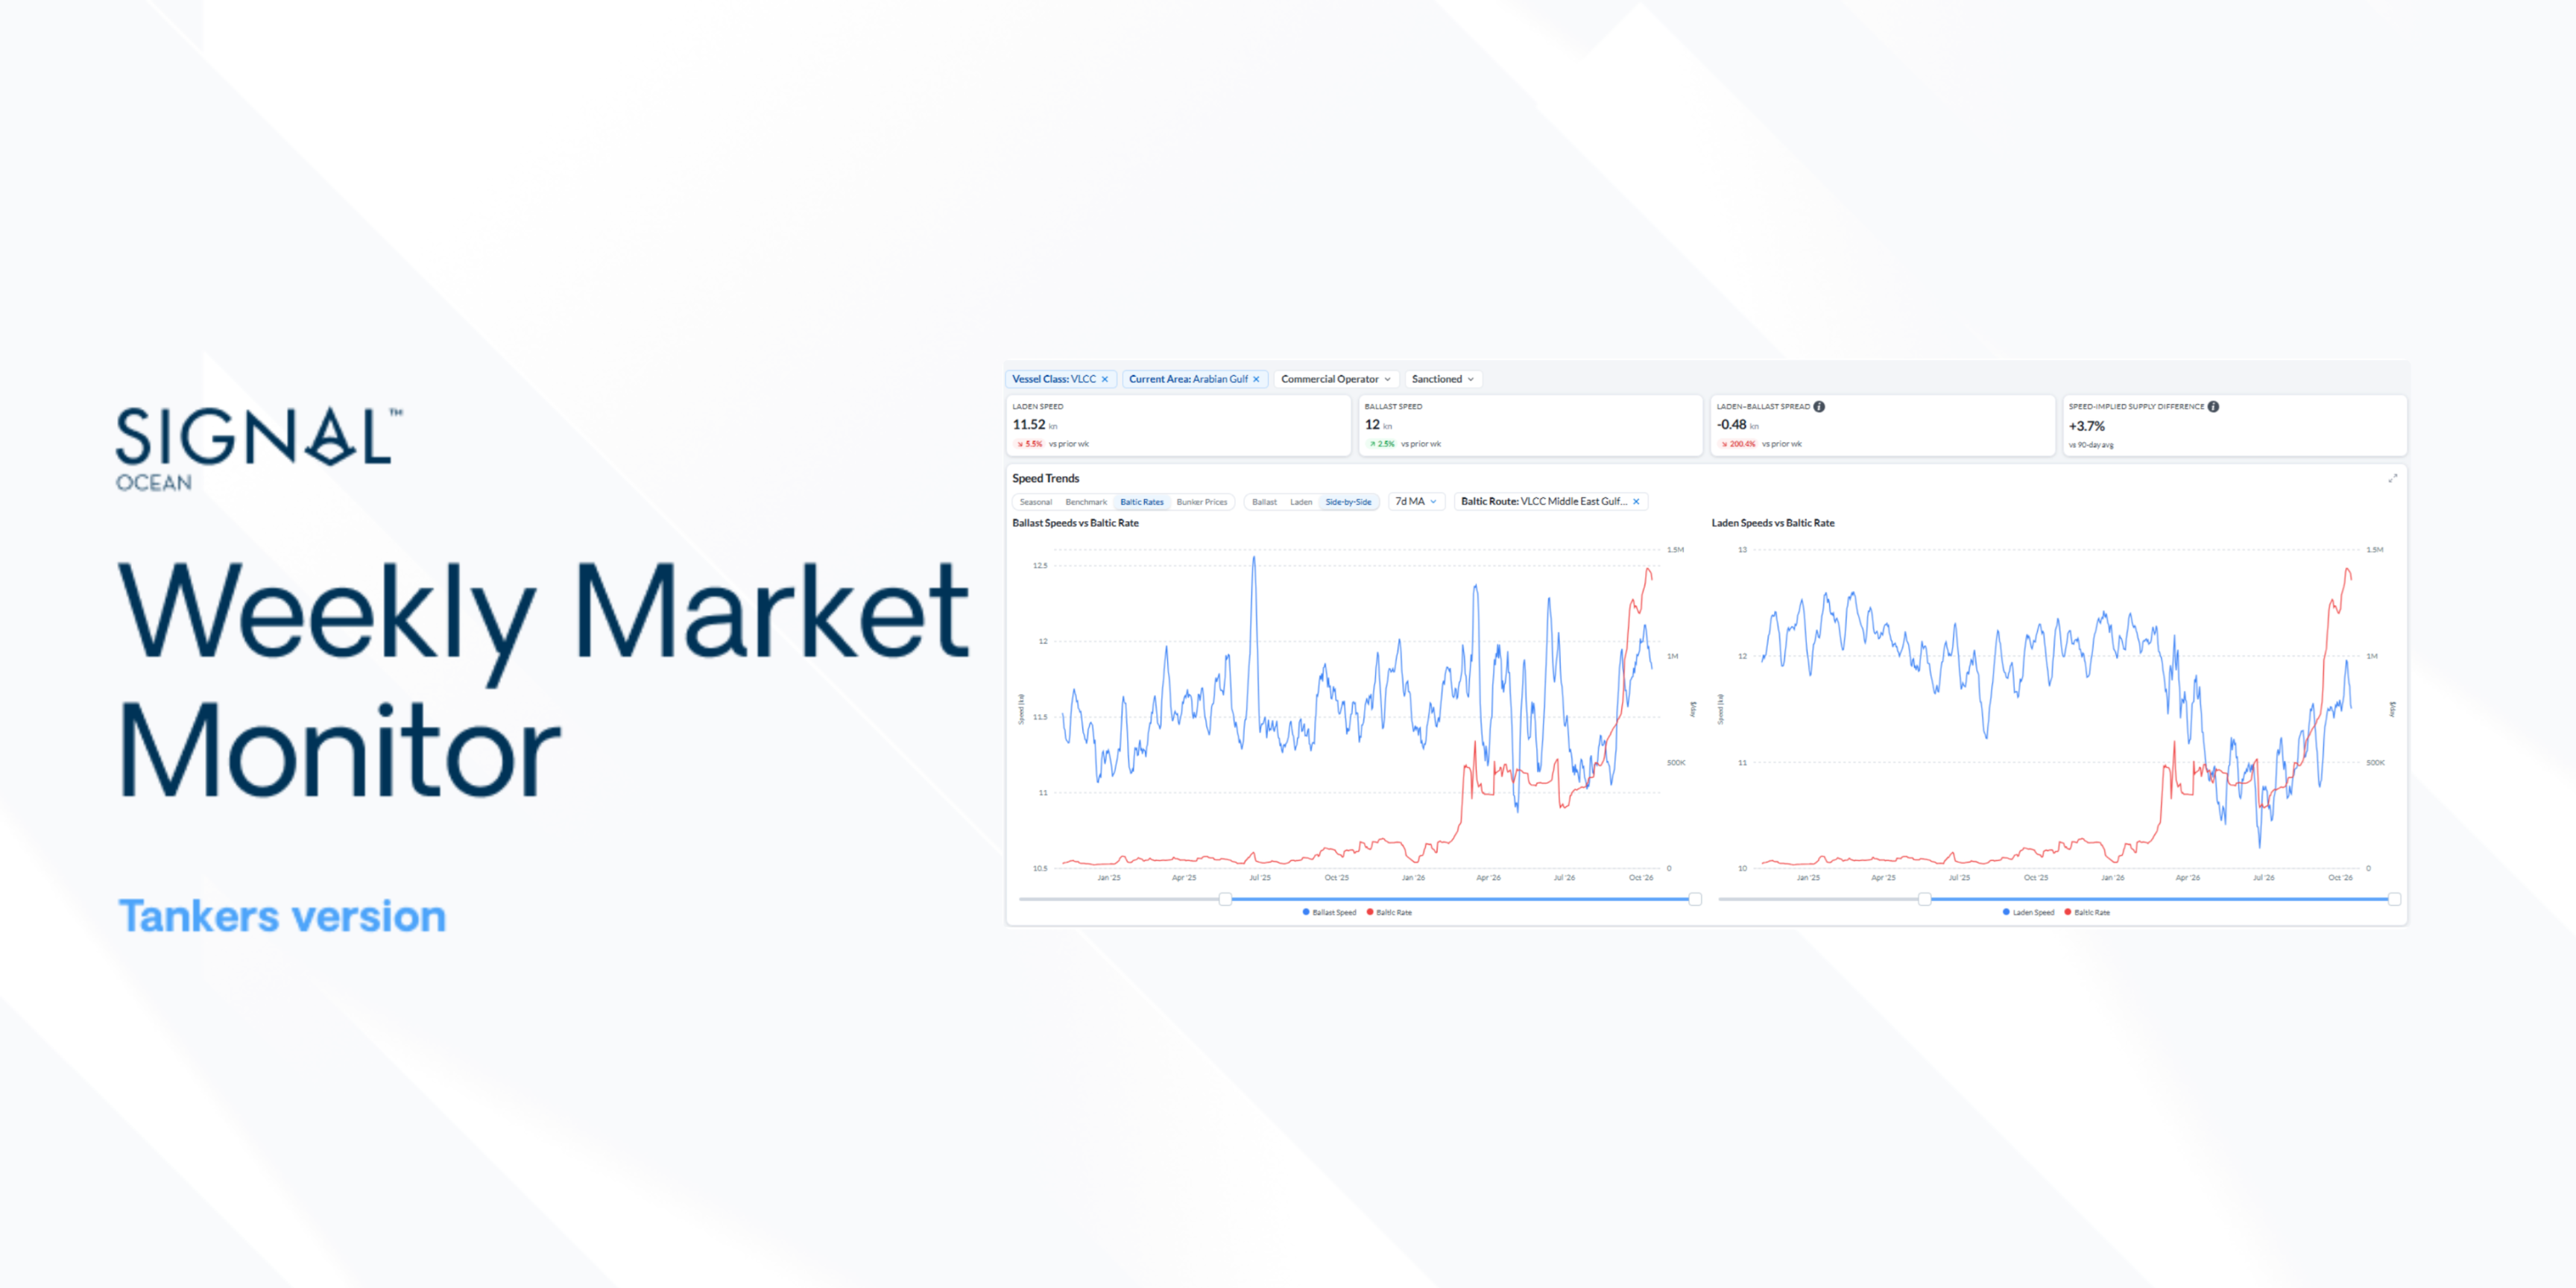
Dashboard view. Signal Ocean Platform, VLCC ballast and laden speeds in the Arabian Gulf; trend panels use a seven-day moving average.
Snapshot of 15 October 2026 with dashboard week-over-week changes; not calendar Week 40–41 averages.

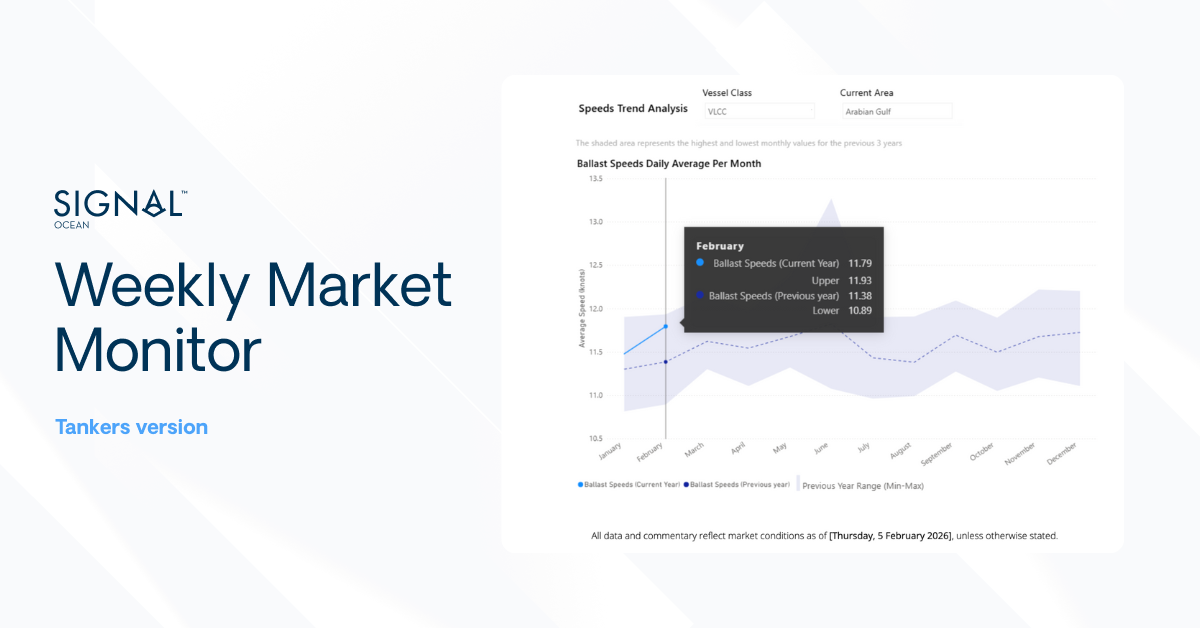
Arabian Gulf VLCC ballast speed reached 12.00 knots, up 2.5% from the previous week, while laden speed declined 5.5% to 11.52 knots, leaving ballast vessels sailing 0.48 knots faster than loaded ships. The current speed-implied supply indicator stood 3.7% above its 90-day average, reflecting faster repositioning rather than an increase in available tonnage. While this may shorten ballast voyages, slower laden sailings, waiting times and cargo transfers continue to affect vessel turnaround, with no clear evidence yet of improved effective VLCC availability.

MARKET SIGNAL:  Western VLCC availability tightened, with the ballast surplus down 23.7%, but the combined at-sea balance did not: a larger eastern surplus left it 2.1% higher. Freight performance split sharply by vessel class, with all four assessed Suezmax routes up on the week and all five western Aframax routes down.

Dirty Freight Outpaces Clean Tankers

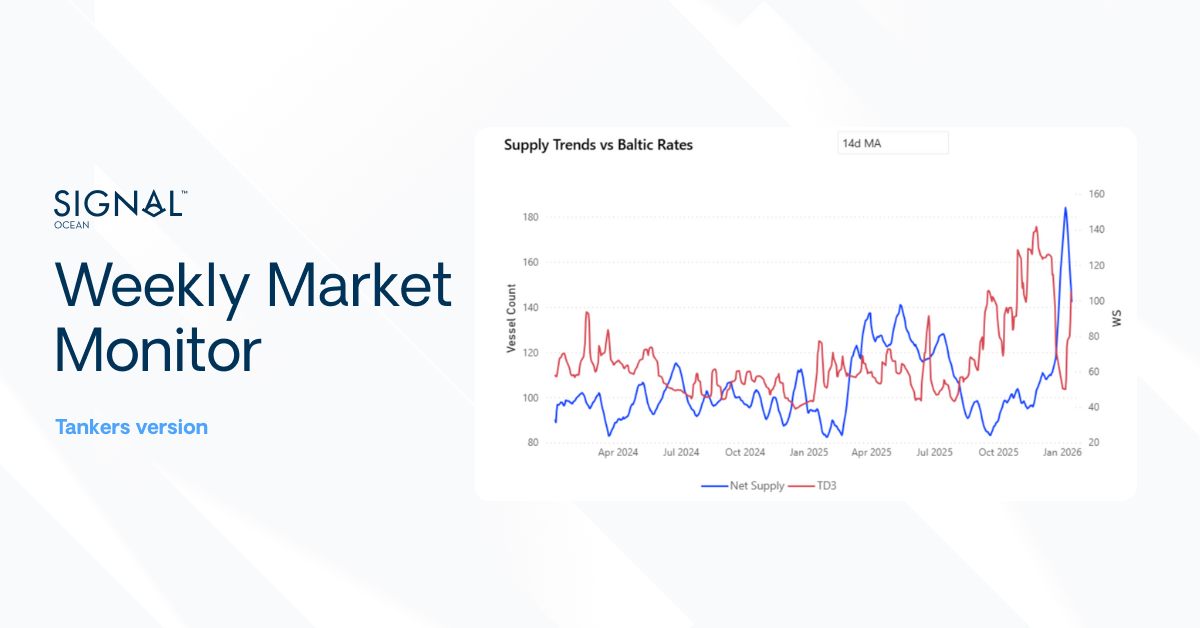
The Baltic Dirty Tanker Index (BDTI) rose 32% to a Week 41 average of 7,625 points, significantly outpacing the 2% increase in the Baltic Clean Tanker Index (BCTI) to 2,388 points. VLCC freight on the Arabian Gulf–China route (TD3C) also strengthened, averaging WS1,288, up 12% from the previous week. By 14 October, the BDTI stood at 7,922 points, easing from its 13 October peak of 7,999, the highest reading in the supplied 12-month series and almost seven times its level a year earlier. The modest pullback leaves crude tanker freight at historically elevated levels, with little indication of a meaningful reversal in the recent upward trend.
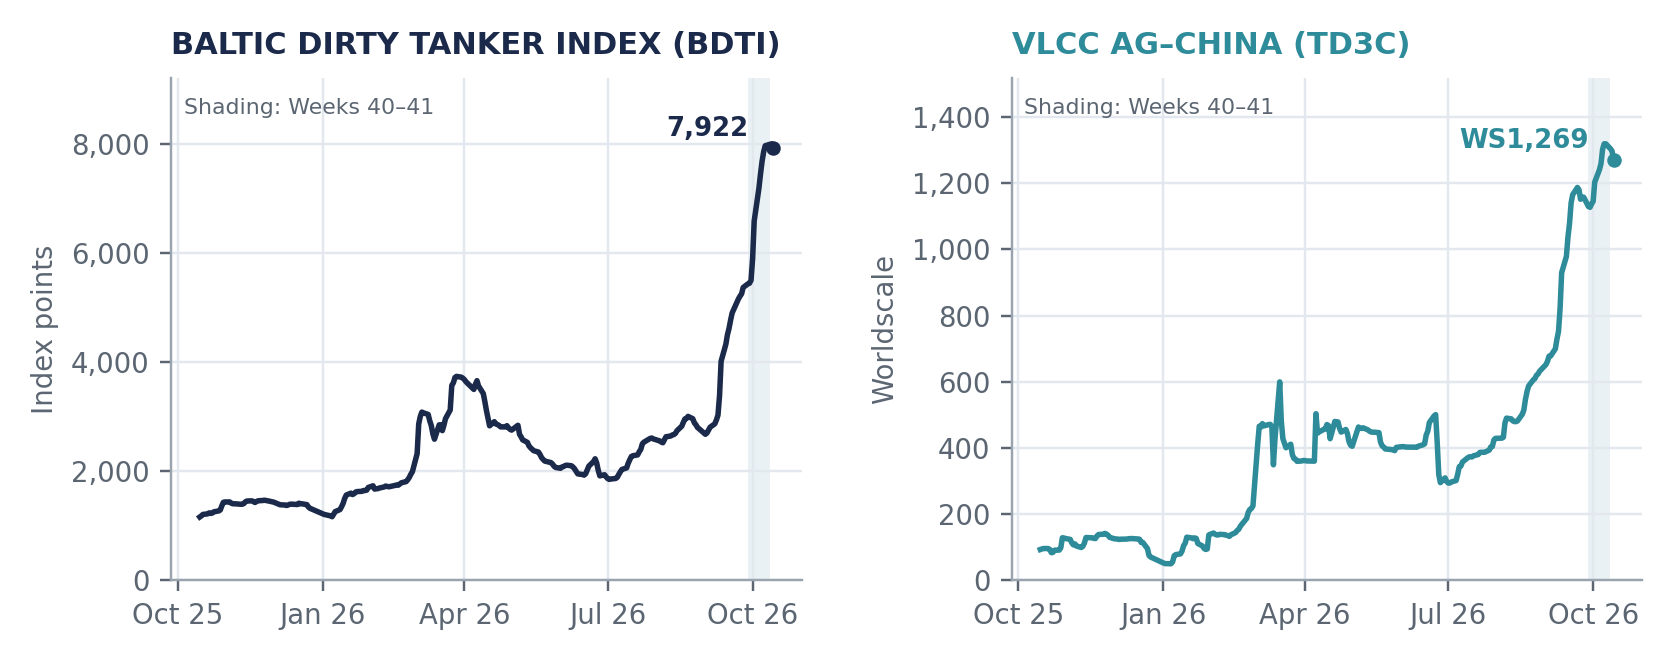
Chart 1.  Baltic Dirty Tanker Index and VLCC AG–China (TD3C), daily, 15 October 2025–14 October 2026. Shading marks Weeks 40–41.
Source: Baltic Exchange assessments via Signal Ocean, data through 14 October 2026.

Baltic index averages: Week 40 vs Week 41

Five assessment days per week: 28 September–2 October and 5–9 October. Sources: Signal for BDTI and TD3C; StockQ for BCTI.

Freight: Gulf VLCC Earnings Lead as Atlantic Aframax Rates Ease

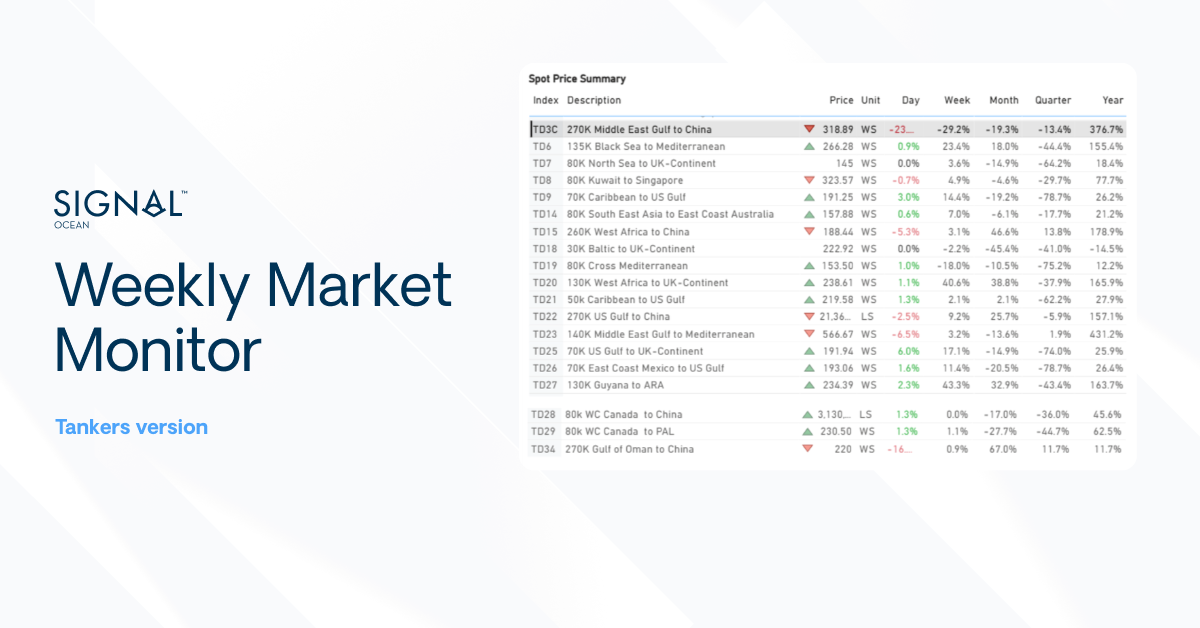
VLCC: In the 15 October snapshot, Gulf routes still carry the highest earnings in the crude basket. MEG–Singapore (TD2) stands at $1,412,730/day, flat on the week, and MEG–China (TD3C) at $1,356,523/day, down 2.8%. AG–China earnings remain 86.0% above West Africa–China (TD15, $729,311/day, -4.0%) and 124.8% above US Gulf–China (TD22, $603,486/day, -2.0%). Over the month, however, the Atlantic routes rose faster: TD22 is up 108.2% and TD15 65.3%, against 31.1% for TD3C.

All four assessed Suezmax routes recorded weekly gains. Black Sea–Mediterranean (TD6) rose 11.7% to $903,854/day, now above MEG–Mediterranean (TD23) at $765,675/day (+1.3%). West Africa–UK Continent (TD20) added 3.1% and Guyana–ARA (TD27) 1.8%.
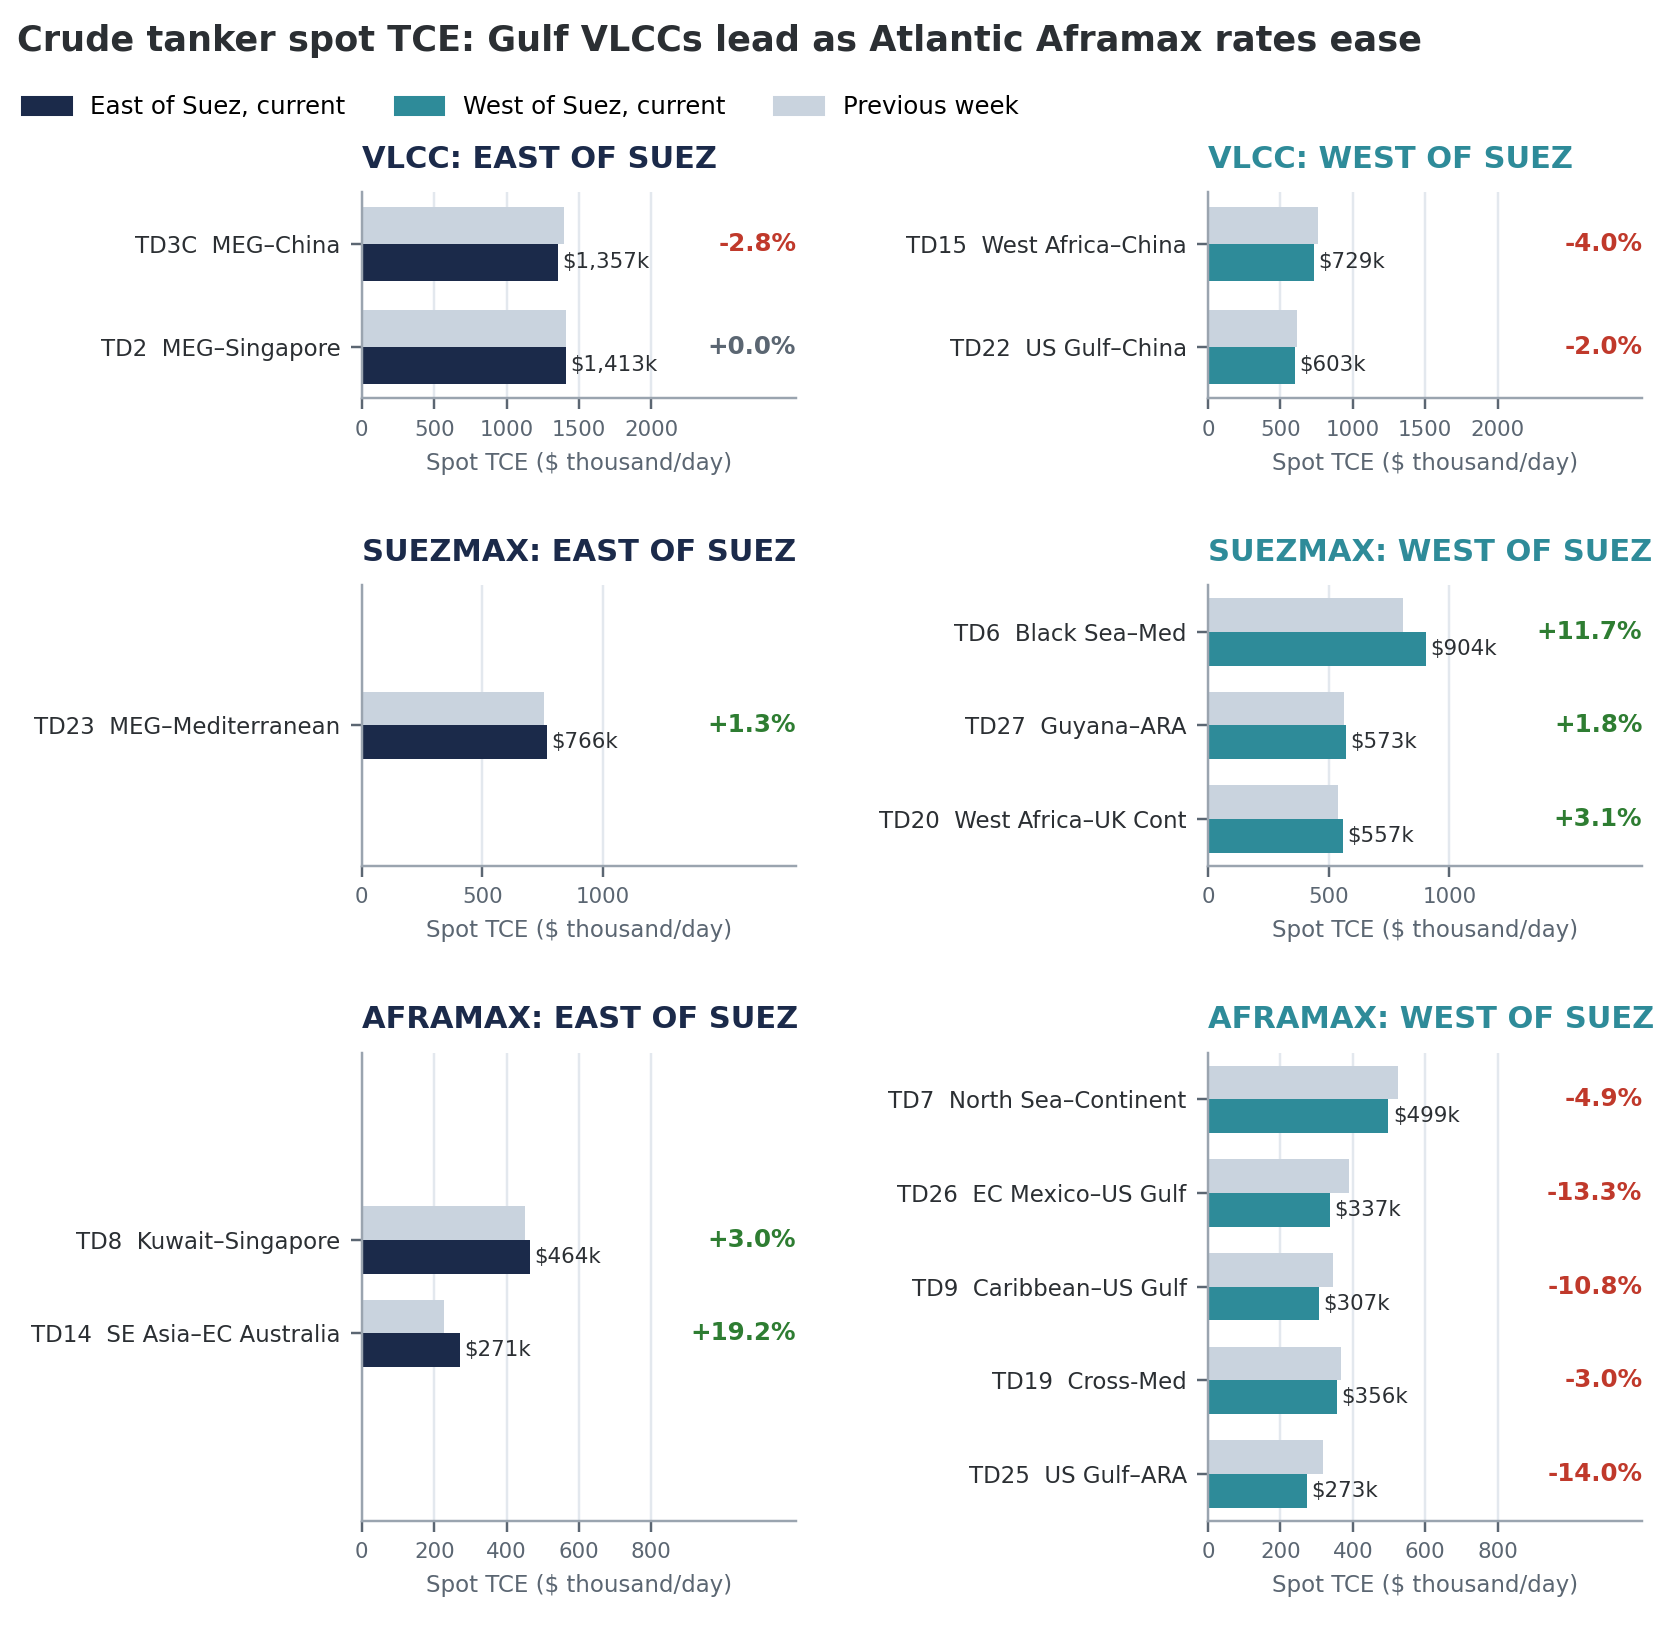
Chart 2.  Crude tanker spot TCE by route and vessel class, East vs West of Suez, current vs previous week ($/day).
Baltic Exchange TCE assessments via Signal Ocean, snapshot dated 15 October; changes against the dashboard’s prior-week reference.

All five western Aframax routes fell, while both eastern routes increased. US Gulf–ARA (TD25) dropped 14.0% to $273,166/day, East Coast Mexico–US Gulf (TD26) 13.3% to $337,127/day and Caribbean–US Gulf (TD9) 10.8% to $307,313/day. 

East of Suez, SE Asia–East Coast Australia (TD14) rose 19.2% to $271,465/day, the largest weekly gain in the basket, and Kuwait–Singapore (TD8) gained 3.0%. In total, nine of the 16 dirty routes declined week on week. All 16 routes remain above their month-earlier levels, with gains ranging from 31.1% to 276.6%.

Spot Rate Summary: dirty TCE, VLCC, Suezmax, Aframax and Panamax

Baltic Exchange TCE assessments via Signal Ocean, snapshot dated 15 October; changes against the dashboard’s prior-week reference. Rates in $/day; all changes are percentages.

VLCC Supply Tightens West of Suez as Eastern Ballast Numbers Rise 

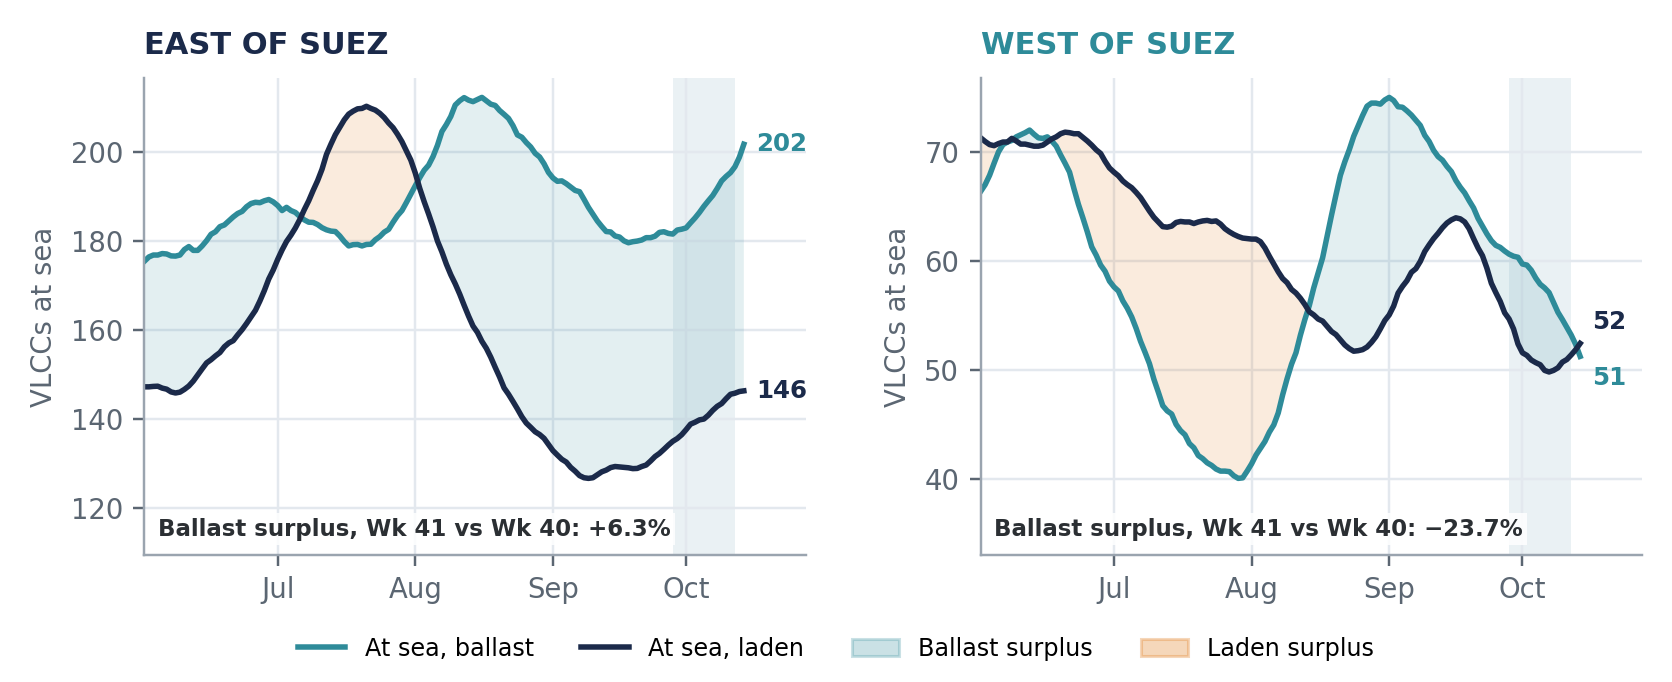
West of Suez, ballast vessels declined 6% to an average of 56, reducing the ballast surplus by 24%, from 8 to 6 vessels. East of Suez, ballast numbers increased 4% to 192, outpacing the rise in laden vessels and lifting the regional surplus by 6% to 49. By 14 October, western laden VLCCs outnumbered ballasters for the first time since mid-August, while eastern ballast numbers continued to rise. The latest figures point to tighter vessel positioning in the Atlantic, against a larger pool of ballast tonnage in the East that has yet to ease exceptional Gulf freight earnings.

VLCCs at sea: Week 40 vs Week 41 averages

Weekly means of seven daily exported measures; surplus is ballast minus laden. These counts do not identify ships ready to accept prompt cargoes.
Chart 3.  VLCCs at sea, ballast vs laden, East and West of Suez, 1 June–14 October 2026. Shading marks Weeks 40–41.
Source: Signal; exported smoothed daily at-sea measures, VLCC 200,000 dwt and above.

Average VLCC counts declined across western regions in Week 41, led by Europe (−26.3%, from 41 to 30), the Atlantic Ocean (−12.8%, from 45 to 39) and the Americas (−9.8%, from 68 to 62). In contrast, counts increased in the Middle East Gulf (+3.8%, from 189 to 196) and Indian Ocean (+6.9%, from 70 to 75). The shift points to a greater concentration of VLCCs in eastern waters, although total vessel counts do not necessarily reflect prompt availability for charter.
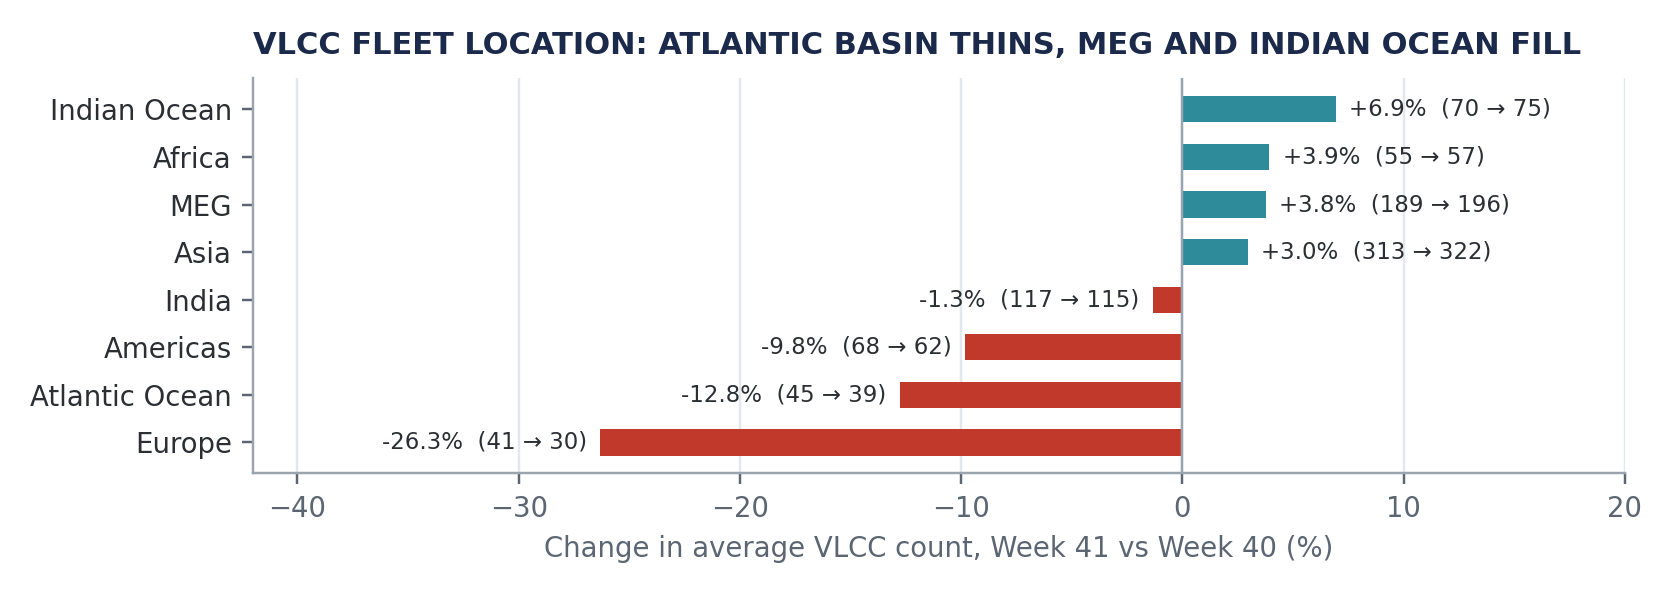
Chart 4.  Average VLCC count by area, Week 41 vs Week 40, all statuses (areas with ten or more vessels).
Source: Signal; fleet distribution by zone, VLCC 200,000 dwt and above.

China Congestion Edges Higher but Stays Below Last Year

China’s VLCC waiting count averaged 12 vessels in Week 41, up 14% from the previous week, while vessels at port remained close to seven. The combined average increased 7% to 19 vessels, with the rise concentrated in the waiting queue. Congestion remained below the same week of 2025, when an average of 14 VLCCs were waiting, and 9 were at port. By 14 October, the daily count had eased to 9 waiting vessels, while 8 were at port, pointing to some moderation in the waiting queue.
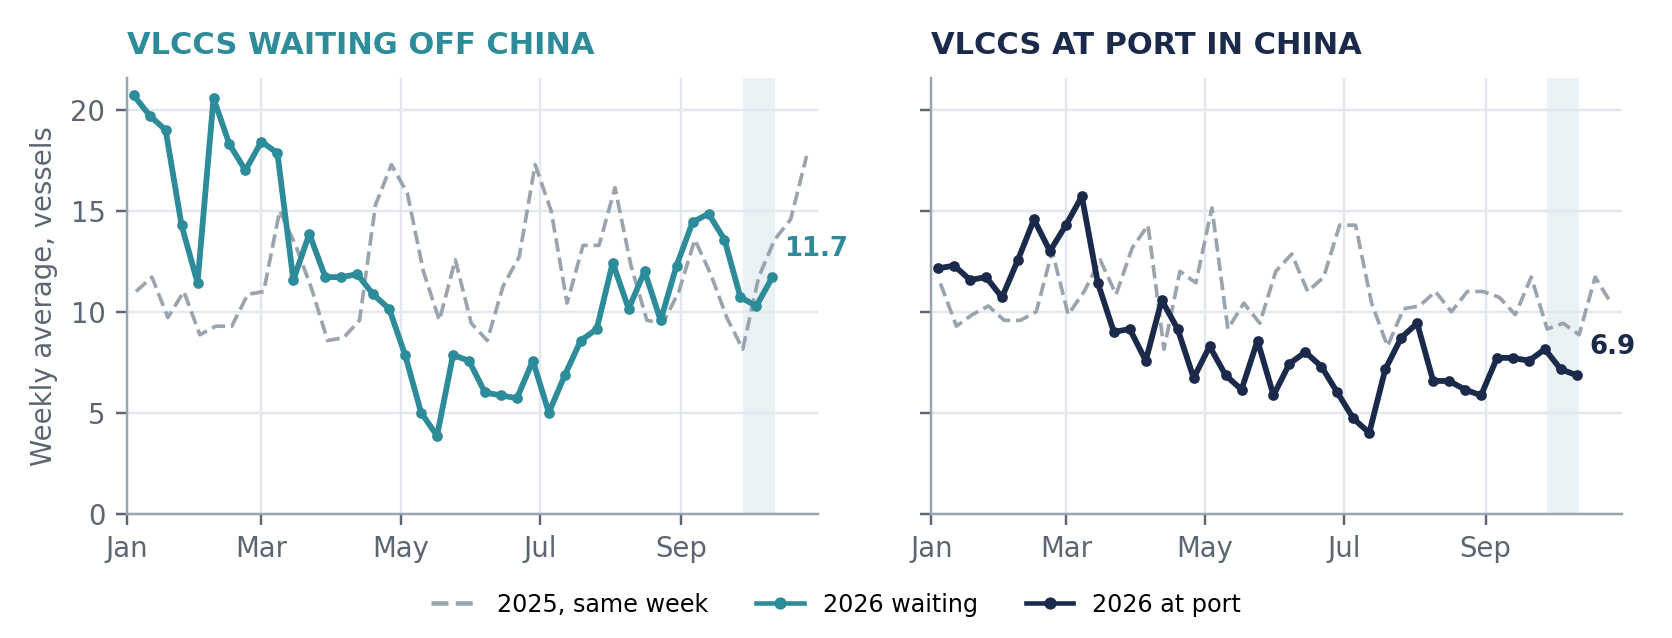
Chart 5.  VLCCs waiting off and at port in China, Monday–Sunday averages, 2026 vs same week of 2025. Shading marks Weeks 40–41.
Source: Signal; congestion data through 11 October 2026.

Hormuz Freight Watch: Bunker Supply Tightens as Saudi Delivered Sales Expand

Marine fuel availability remains constrained across key bunkering hubs, while Saudi Arabia expands delivered crude sales to Asian refiners. Renewed attacks in Hormuz continue to complicate vessel deployment and loading arrangements.

Bunker fuel constraints: Marine fuel availability remains tight across several East of Suez locations. In Singapore, recommended lead times have extended to 11–18 days for VLSFO and 11–17 days for HSFO. Fujairah has seen some improvement in VLSFO availability, although HSFO and LSMGO supplies remain limited. Port Suez is also reporting critically low inventories across conventional bunker grades. These constraints add to voyage planning requirements, particularly for vessels operating between the Gulf, Red Sea and Asian discharge ports.

Saudi delivered crude sales: Chinese refiners purchased at least 12 million barrels of Saudi crude for November loading on a delivered basis, with additional sales to India and Taiwan. Buyers' reluctance to charter vessels for loading inside Hormuz has encouraged Saudi Arabia to arrange transportation directly, while allocations continue through Yanbu and Sidi Kerir. This keeps crude moving but transfers responsibility for securing tanker capacity to the seller.

Hormuz security: UKMTO reported projectile strikes involving a tanker and container ship on 13 October. Singapore's maritime authority separately confirmed that GFS Pride was struck and subsequently sank, while GFS Giselle sustained damage and reached safe anchorage following an attack on 14 October. These incidents reinforce the continuing uncertainty surrounding Gulf transits.

Maria Bertzeletou
Senior Market Analyst
LinkedIn
Maria holds a M.Sc. in Shipping, Trade and Finance from the Bayes Business School at the City University in London and a B.Sc. in Shipping Economics from the University of Piraeus.
Creating a sustainable world requires us to embark on a journey towards a zero emission future, where every step is a commitment to preserve our planet for future generations.
Albert Greenway
Environmental Scientist, Sustainability Expert
No items found.

Increased Use of Renewable Energy:

Shipping companies are embracing renewable energy sources to power onboard systems and reduce emissions during port operations. Solar panels and wind turbines are being installed on vessels to generate clean energy, reducing reliance on auxiliary engines, and cutting down emissions. Shore power facilities in ports allow ships to connect to the electrical grid, eliminating the need for onboard generators while docked.

Collaboration and Industry Partnerships:

Recognizing that addressing emissions requires collective action, shipping companies, governments, and organizations have formed partnerships and collaborations. These initiatives focus on research and development, sharing best practices, and promoting knowledge transfer. Joint projects aim to develop and deploy innovative technologies, improve infrastructure, and create a supportive regulatory framework to accelerate the industry's transition towards a greener future. The Zero Emission Shipping - Mission Innovation.

To pave the way for a greener future in shipping, the availability of alternative fuels plays a vital role in their widespread adoption. However, this availability is influenced by factors such as port infrastructure, local regulations, and government policies. As the demand for cleaner fuels in shipping rises and environmental regulations become more stringent, efforts are underway to improve the accessibility of these fuels through infrastructure development, collaborations, and investments in production facilities.

Liquefied Natural Gas (LNG) infrastructure has seen significant growth in recent years, resulting in more LNG bunkering facilities and LNG-powered vessels. Nonetheless, the availability of LNG as a marine fuel can still vary depending on the region. To ensure consistent availability worldwide, there is a need for further development of LNG supply chains and infrastructure. For biofuels, their availability hinges on production capacity and the availability of feedstock. Although biofuels are being produced and utilized in various sectors, their availability as a marine fuel remains limited. Scaling up biofuel production and establishing robust supply chains are imperative to ensure wider availability within the shipping industry.Hydrogen, as a fuel for maritime applications, is still in the early stages of infrastructure development. While some hydrogen vessels have been tested or introduced in the first quarter of last year, the infrastructure required for hydrogen production and distribution needs further advancement.

Ammonia, as a marine fuel, currently faces limitations in availability. The production, storage, and handling infrastructure for ammonia need further development to support its widespread use in the shipping industry.Methanol, on the other hand, is already a commercially available fuel and has been used as a blend with conventional fuels in some ships. However, its availability as a standalone marine fuel can still be limited in certain regions. Bureau Veritas in October 2022 published a White Paper for the Alternative Fuels Outlook. This white paper provides a comprehensive overview of alternative fuels for the shipping industry, taking into account key factors such as technological maturity, availability, safety, emissions, and regulations.

Creating a sustainable world requires us to embark on a journey towards a zero emission future, where every step is a commitment to preserve our planet for future generations.
Albert Greenway
Environmental Scientist, Sustainability Expert

Increased Use of Renewable Energy:

Shipping companies are embracing renewable energy sources to power onboard systems and reduce emissions during port operations. Solar panels and wind turbines are being installed on vessels to generate clean energy, reducing reliance on auxiliary engines, and cutting down emissions. Shore power facilities in ports allow ships to connect to the electrical grid, eliminating the need for onboard generators while docked.

Collaboration and Industry Partnerships:

Recognizing that addressing emissions requires collective action, shipping companies, governments, and organizations have formed partnerships and collaborations. These initiatives focus on research and development, sharing best practices, and promoting knowledge transfer. Joint projects aim to develop and deploy innovative technologies, improve infrastructure, and create a supportive regulatory framework to accelerate the industry's transition towards a greener future. The Zero Emission Shipping - Mission Innovation.

To pave the way for a greener future in shipping, the availability of alternative fuels plays a vital role in their widespread adoption. However, this availability is influenced by factors such as port infrastructure, local regulations, and government policies. As the demand for cleaner fuels in shipping rises and environmental regulations become more stringent, efforts are underway to improve the accessibility of these fuels through infrastructure development, collaborations, and investments in production facilities.

Liquefied Natural Gas (LNG) infrastructure has seen significant growth in recent years, resulting in more LNG bunkering facilities and LNG-powered vessels. Nonetheless, the availability of LNG as a marine fuel can still vary depending on the region. To ensure consistent availability worldwide, there is a need for further development of LNG supply chains and infrastructure. For biofuels, their availability hinges on production capacity and the availability of feedstock. Although biofuels are being produced and utilized in various sectors, their availability as a marine fuel remains limited. Scaling up biofuel production and establishing robust supply chains are imperative to ensure wider availability within the shipping industry.Hydrogen, as a fuel for maritime applications, is still in the early stages of infrastructure development. While some hydrogen vessels have been tested or introduced in the first quarter of last year, the infrastructure required for hydrogen production and distribution needs further advancement.

Ammonia, as a marine fuel, currently faces limitations in availability. The production, storage, and handling infrastructure for ammonia need further development to support its widespread use in the shipping industry.Methanol, on the other hand, is already a commercially available fuel and has been used as a blend with conventional fuels in some ships. However, its availability as a standalone marine fuel can still be limited in certain regions. Bureau Veritas in October 2022 published a White Paper for the Alternative Fuels Outlook. This white paper provides a comprehensive overview of alternative fuels for the shipping industry, taking into account key factors such as technological maturity, availability, safety, emissions, and regulations.

Ready to get started and outrun your competition?
Request a Demo

Read next