Subscribe for our latest news, straight to your inbox:
Thank you! Your submission has been received!
Oops! Something went wrong while submitting the form.
Share this post
Weekly Tanker Market Monitor
Beyond Hormuz · Week 45, 2026
Published November 2026
By Maria Bertzeletou · Senior Market Analyst, Signal
SPOTLIGHT OF THE WEEK
Atlantic Tanker Earnings Fall Faster Than Gulf Earnings
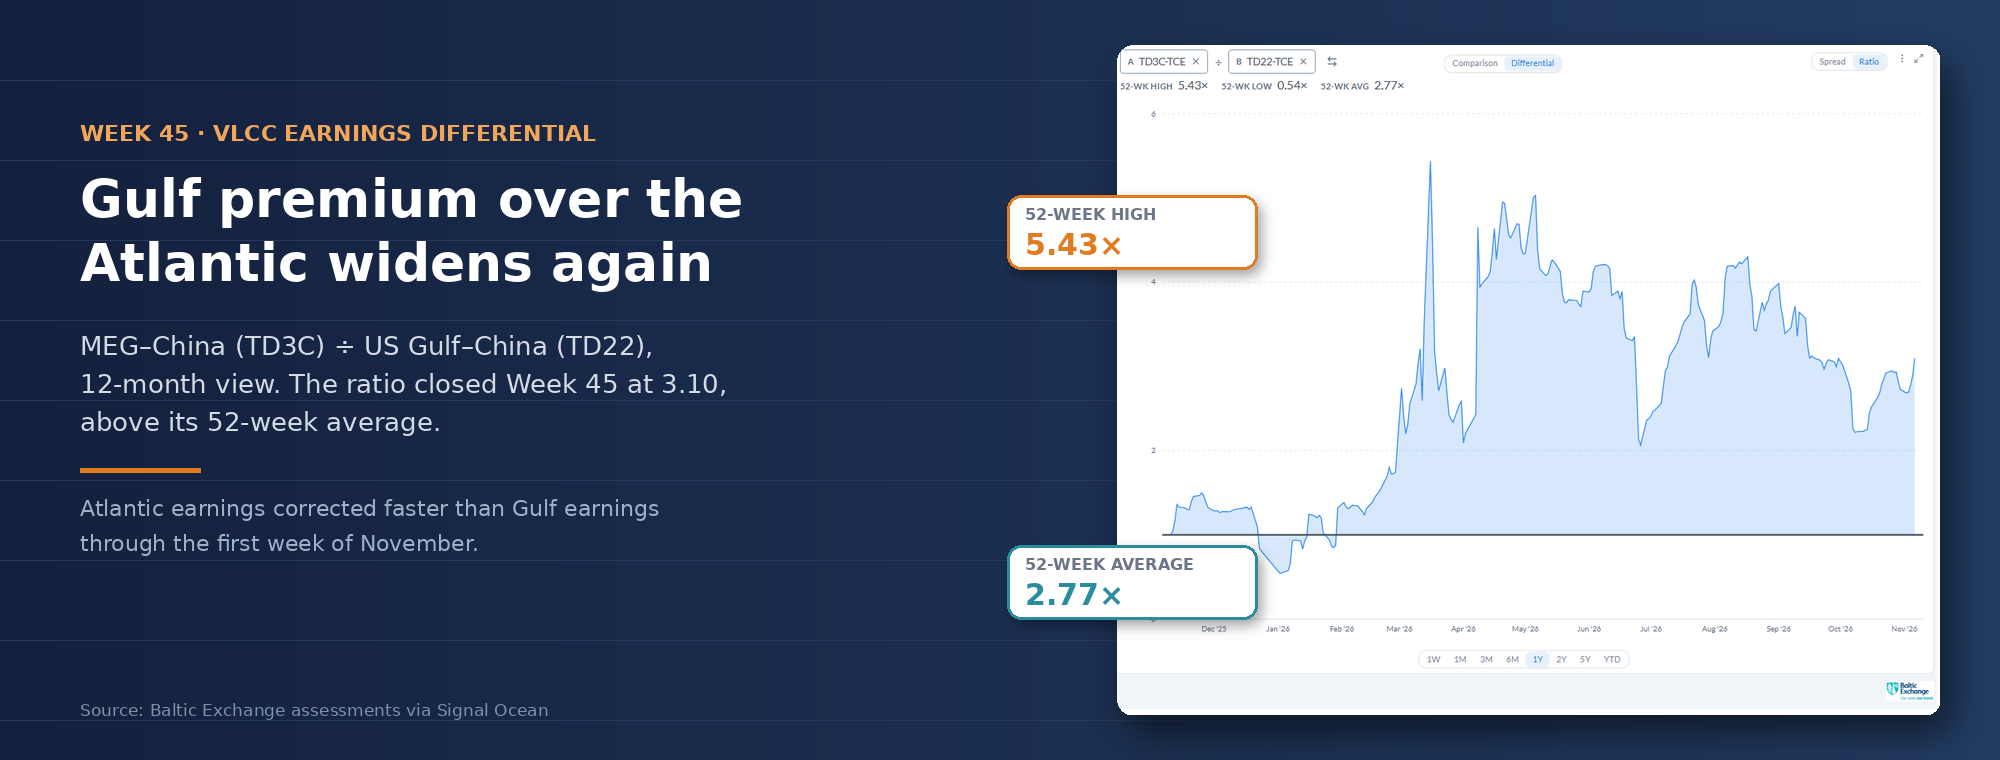
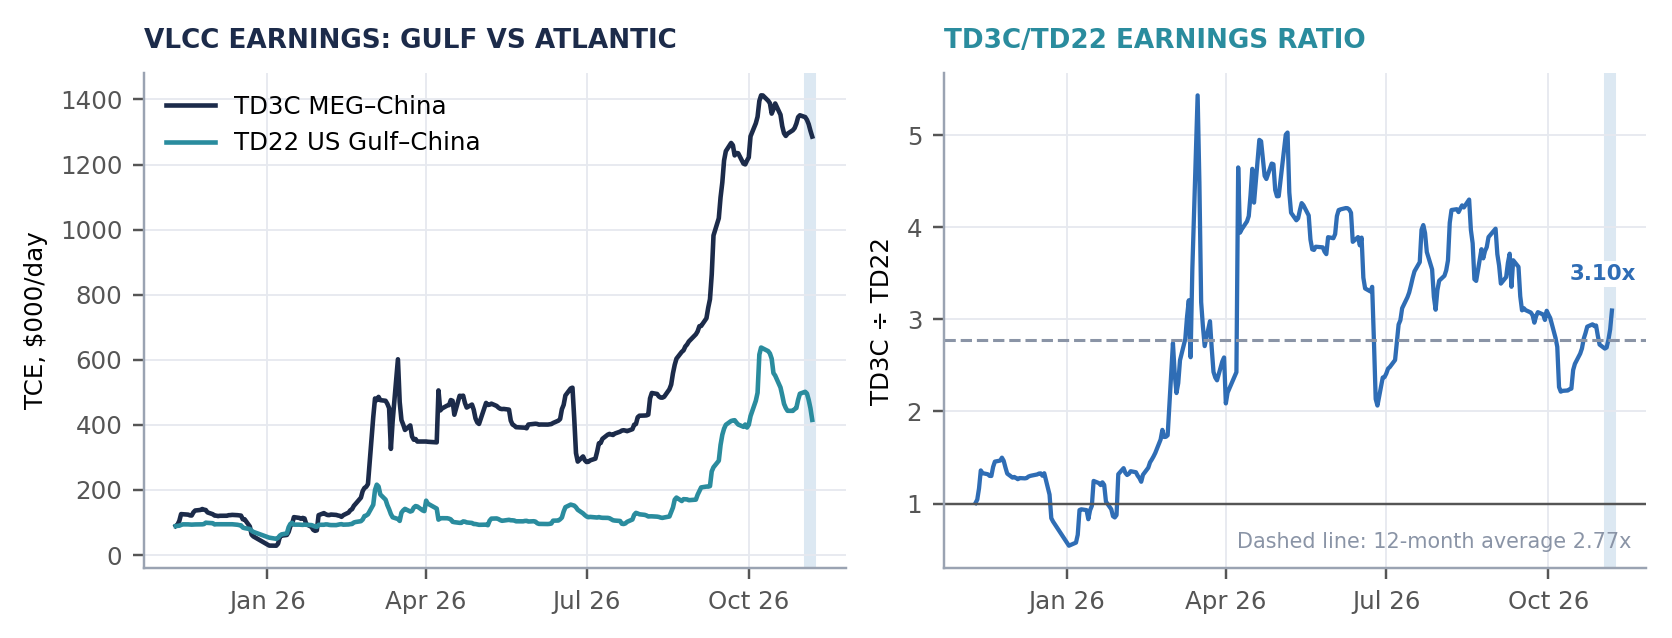
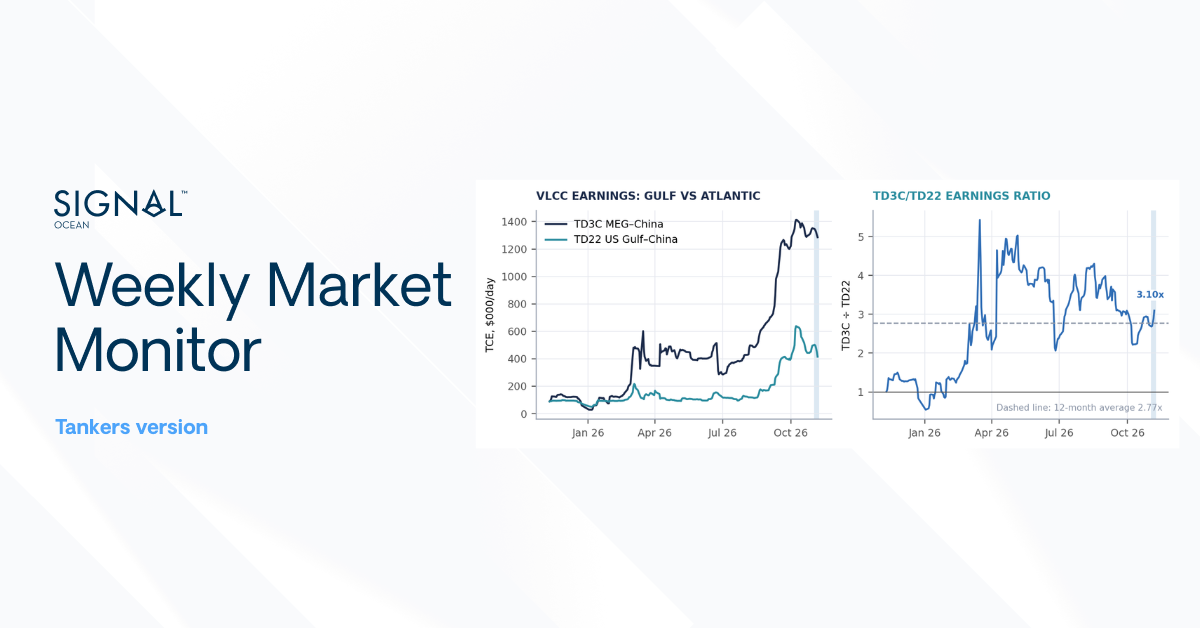
The TD3C/TD22 earnings ratio rose from 2.73 on 30 October to 3.10 on 6 November, as US Gulf–China VLCC earnings fell 16.2% to around $415,000/day, against a 4.8% decline on Middle East Gulf–China to $1.29 million/day. All 16 dirty tanker benchmarks fell over the week, with the steepest declines in the Atlantic and Mediterranean. Several Suezmax and Aframax routes lost 50% or more of their earnings, while Middle East Gulf VLCC losses remained below 5%.
Chart 1. Daily TD3C and TD22 TCE assessments and their ratio, 10 November 2025–6 November 2026. Source: Baltic Exchange assessments via Signal Ocean. Daily TCEs derived from the Signal Ocean TD3C/TD22 differential series; derived values match the route assessments for 30 October and 6 November.
Both TD3C (Middle East Gulf–China) and TD22 (US Gulf–China) reached their October earnings peaks on 8 October, although the subsequent correction has been considerably sharper on the Atlantic route. By 6 November, TD22 earnings had fallen 34.9% from their October high, compared with a 9.0% decline on TD3C. The sharper fall in Atlantic earnings pushed the TD3C/TD22 ratio to 3.10 at the end of the week, its highest level since 18 September and above its 12-month average of 2.77.
Period averages are arithmetic means of daily observations; the ratio row averages daily ratios.
Freight: Atlantic Crude Routes Lead the Decline
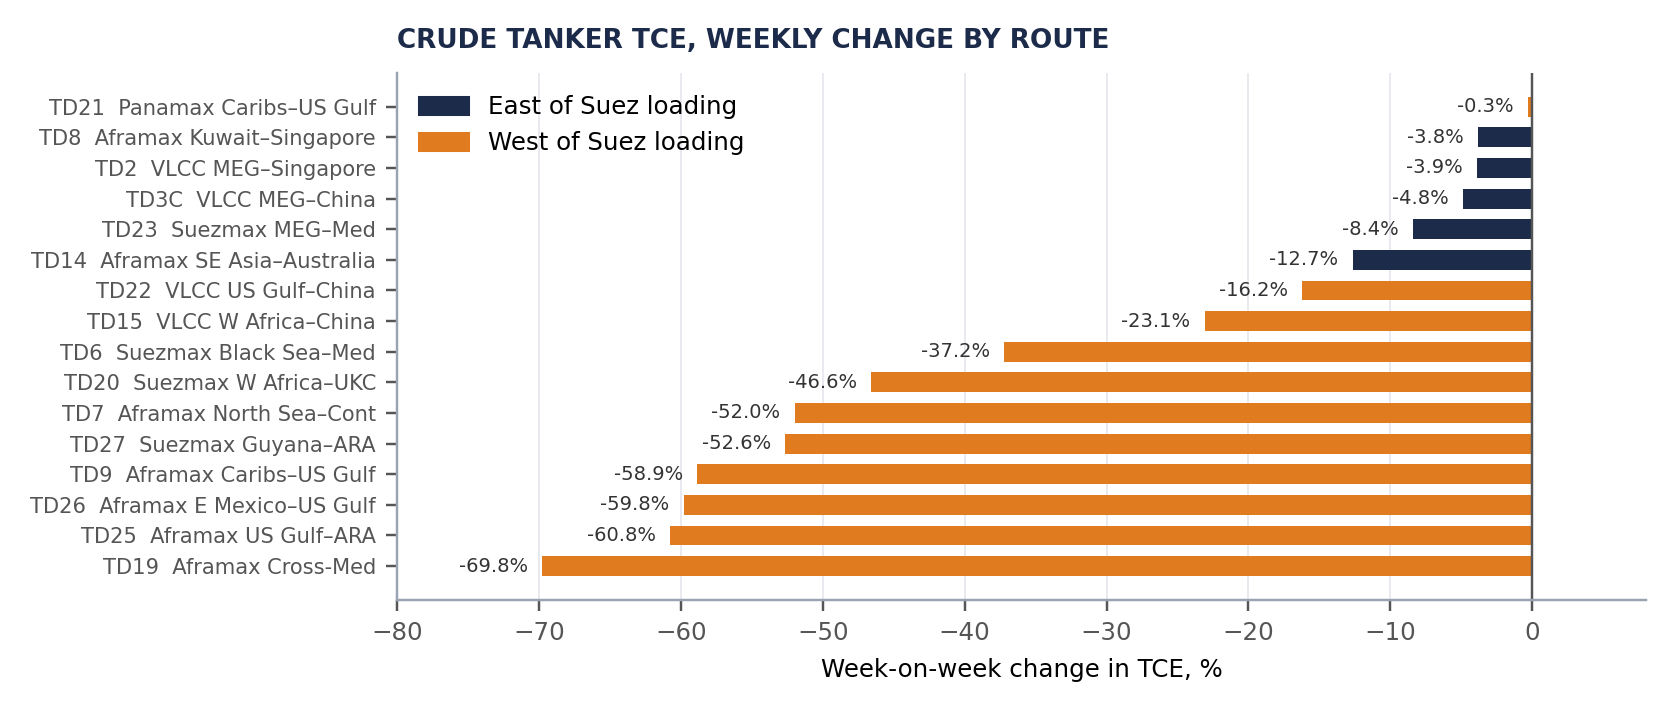
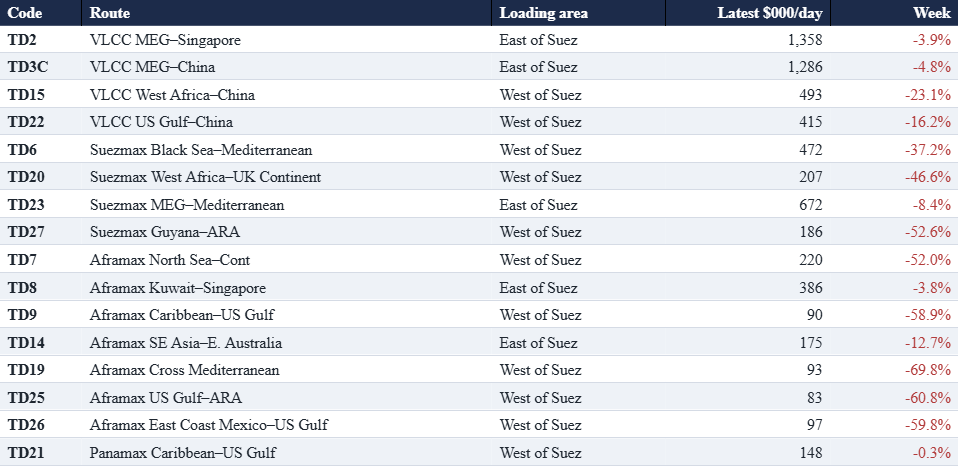
The ten largest percentage declines in the dirty basket were all on routes loading West of Suez, as classified in Chart 2 and the table below. Suezmax West Africa–UK Continent (TD20) fell 46.6%, Guyana–ARA (TD27) 52.6%, and Black Sea–Mediterranean (TD6) 37.2%, while MEG–Mediterranean (TD23) fell 8.4% and remained 3.2 times TD20. Among Aframaxes, Cross-Mediterranean (TD19) fell 69.8% and US Gulf–ARA (TD25) fell 60.8%, against 3.8% on Kuwait–Singapore (TD8). All 16 routes remain above their year-earlier and three-month reference levels.
Chart 2. Crude tanker TCE, percentage change against each route’s prior-week reference, by loading area.Source: Baltic Exchange TCE assessments via Signal Ocean.
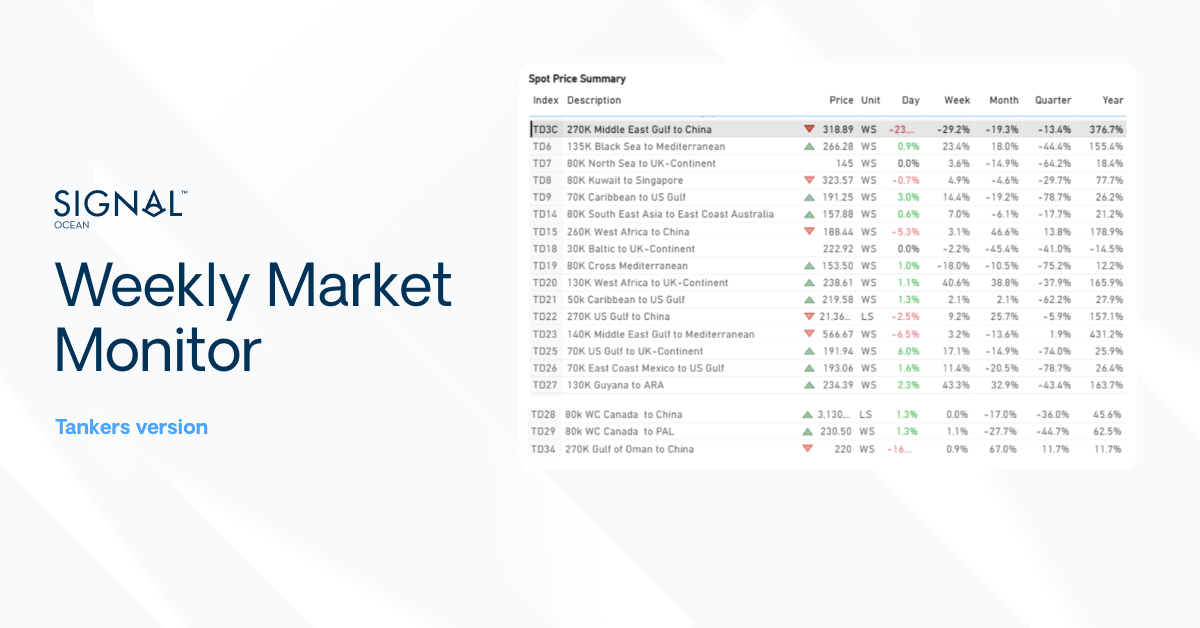
Spot Rate Summary: dirty TCE, VLCC, Suezmax, Aframax and Panamax
Baltic Exchange TCE assessments via Signal Ocean; USD/day rounded to the nearest $1,000. Weekly change against each route’s prior-week reference. TD3C and TD22 reconcile to 6 November.
Supply: Westbound Ballasters Rise as the Fleet Stays East
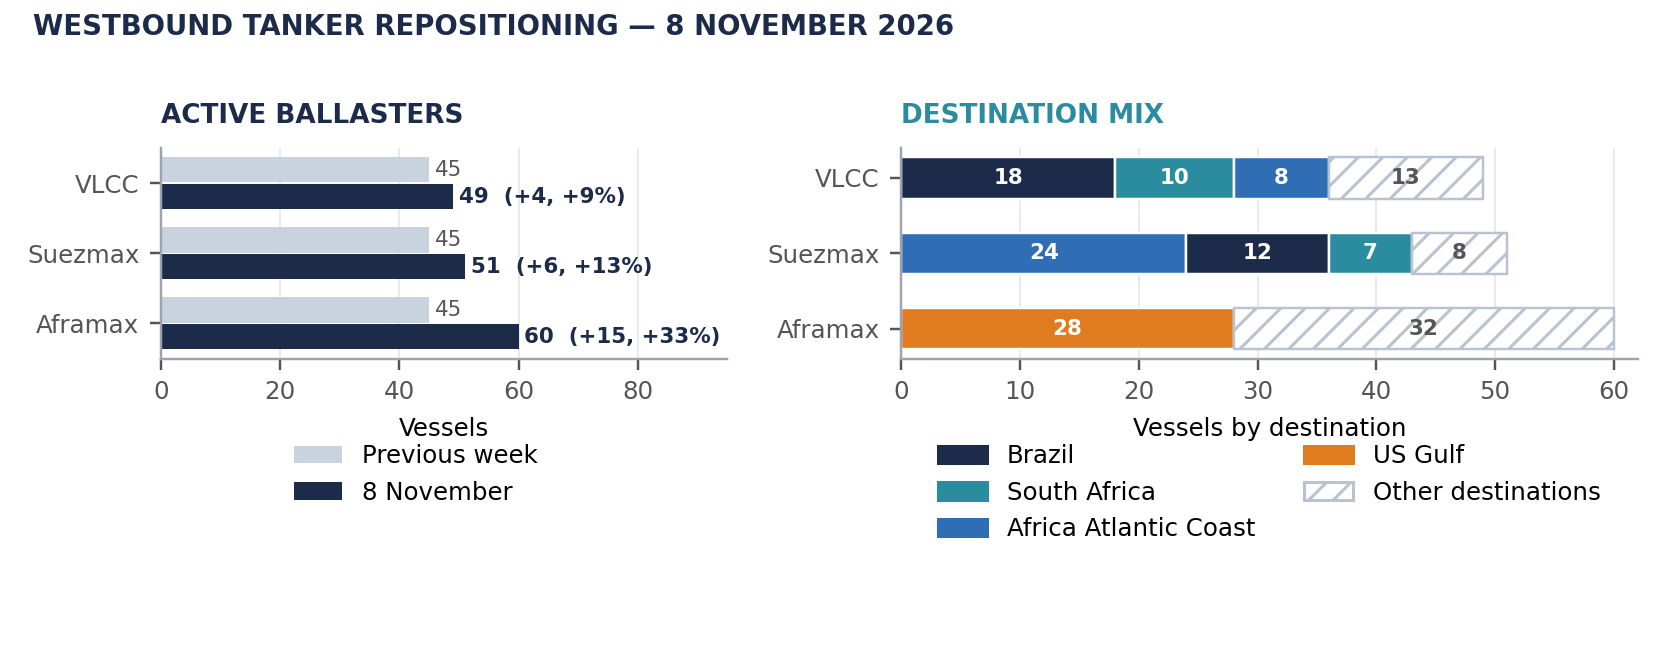
Signal Maritime recorded 49 active westbound VLCC ballasters on 8 November, compared with 45 a week earlier. Of these, 43 originated in the Far East. Brazil was the leading destination with 18 vessels, followed by South Africa with 10 and the African Atlantic Coast with eight. The count remains below the late-October peak of 52, and monthly East-to-West ballast movements fell from 73 in September to 50 in October.
Westbound positioning rose faster in the smaller crude segments. Suezmax ballasters increased to 51 from 45 a week earlier, with 24 heading for the Africa Atlantic Coast. Aframax ballasters rose to 60 on 7 November from 45 on 31 October, with 28 heading for the US Gulf. Arrival dates, onward employment and regional cargo demand will determine how much of this tonnage becomes available for fixing.
Chart 3. Active westbound VLCC, Suezmax and Aframax ballasters compared with the previous week, and their destination mix. Active counts represent vessels in transit rather than immediately available tonnage.Source: Signal Maritime Key Insights, 8 November 2026. Aframax comparison: 31 October vs 7 November. “Other destinations” is the segment total minus the listed destinations.
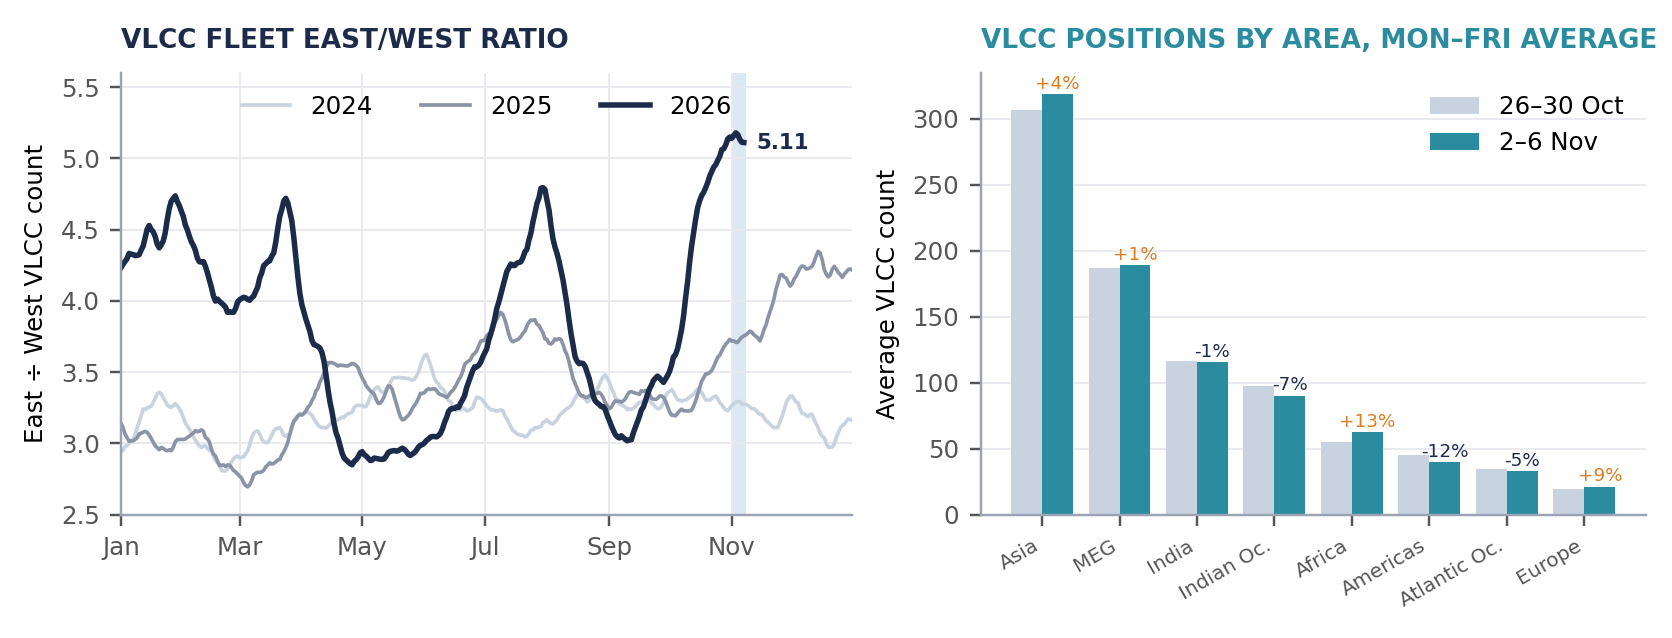
Chart 4. East/West VLCC fleet ratio by calendar day, 2024–2026, and average VLCC positions, 26–30 October vs 2–6 November 2026.Sources: Signal Ocean Fleet Distribution and Distribution by Zone; international-trading VLCCs, 200,000 dwt and above.
The increase in westbound ballasters contrasts with the continued concentration of VLCC tonnage east of Suez. The East/West fleet ratio stood at 5.11 on 7 November, close to its 2026 high of 5.18, compared with 3.75 in 2025 and 3.27 in 2024. Regionally, VLCC positions increased by 13.0% around Africa and 9.2% in Europe, while the Americas recorded a 12.3% decline. The Middle East Gulf count was broadly unchanged at 189 vessels. These figures capture the geographical distribution of VLCCs across all employment states, rather than the number of vessels immediately available for new employment.
Flows and Transport Costs
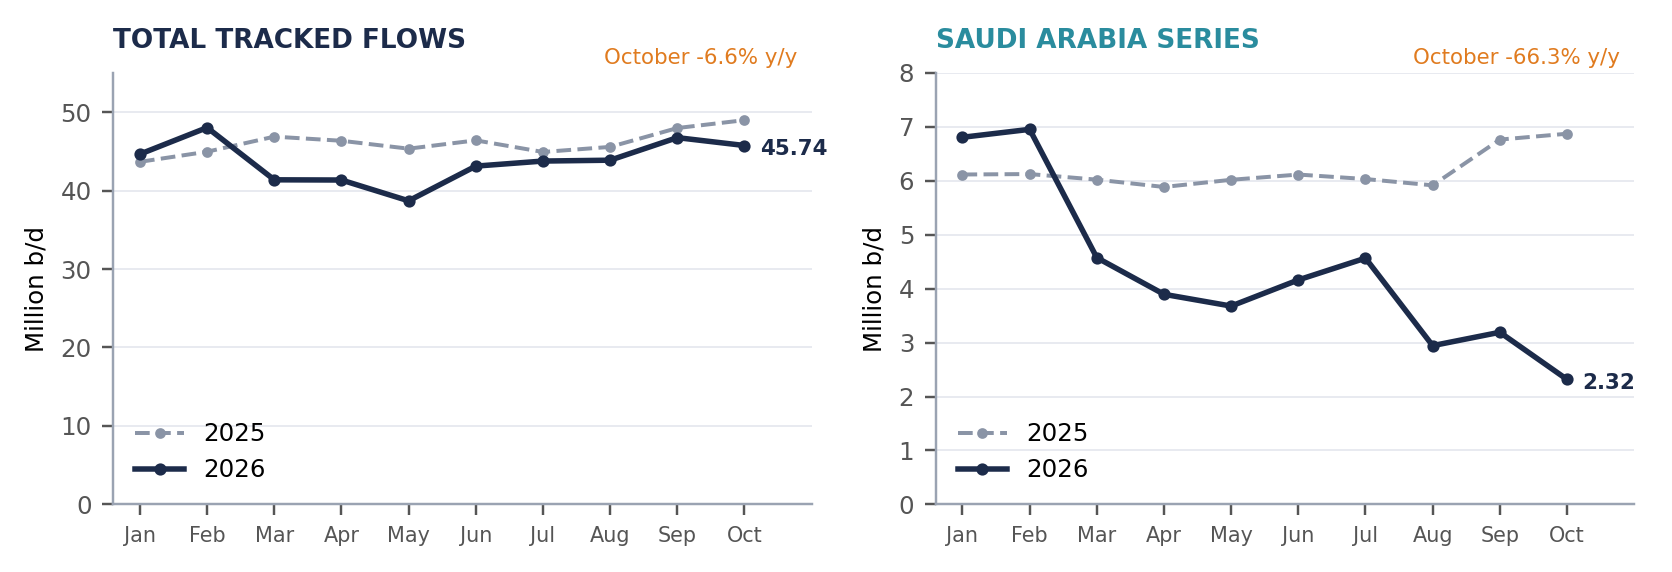
Signal Ocean tracked crude flows from all origins averaged 45.7 million b/d in October, down 6.6% year on year but well above May’s low. Tracked flows attributed to Saudi Arabia averaged 2.32 million b/d, down 66.3% year on year and below every earlier month of 2026. These are tracked and attributed flows, not a definitive measure of physical Saudi crude exports: the comparison does not establish how much of the decline reflects lower physical exports or changes in the attribution of ship-to-ship cargoes.
Chart 5. Signal Ocean tracked crude flows, all origins and Saudi Arabia attribution, monthly averages, January–October 2026 vs 2025. Panels use different scales.Source: Signal Ocean crude export dataset; monthly volumes divided by calendar days. Country attribution reflects the loading location and ship-to-ship treatment; subject to revision.
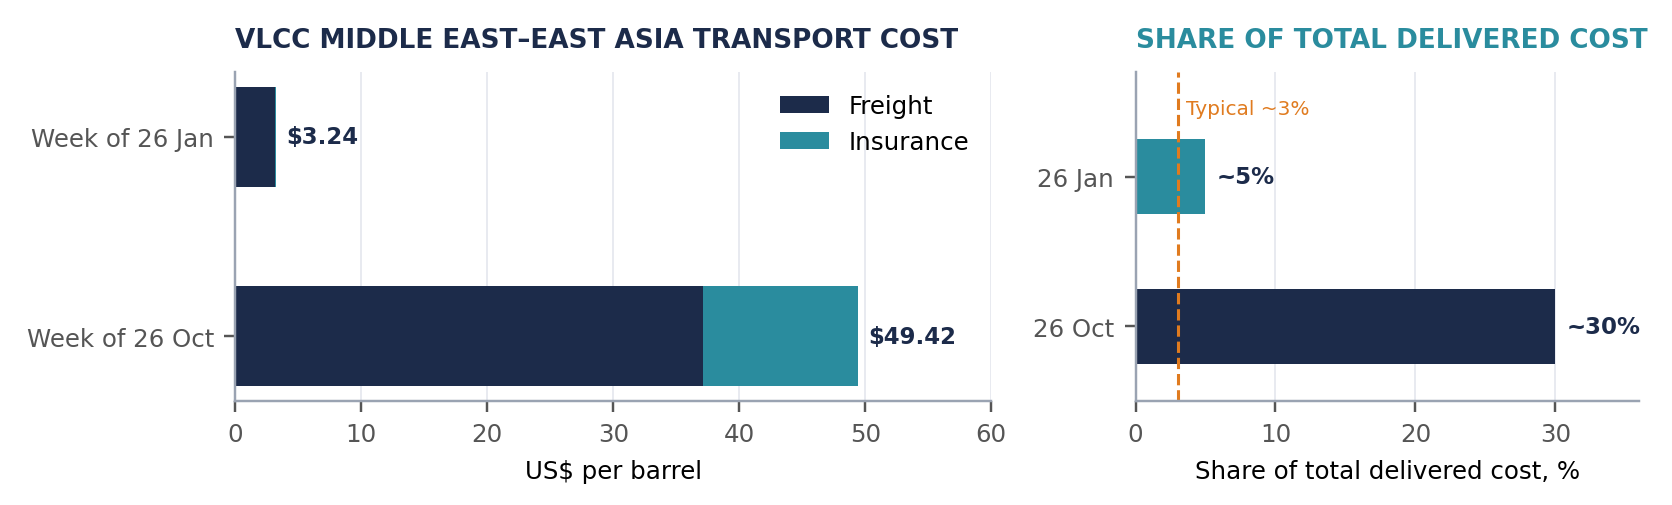
OPEC estimates that Middle East–East Asia VLCC freight rose from $3.18/bbl in the week of 26 January to $37.13/bbl in the week of 26 October, and insurance from $0.06/bbl to $12.29/bbl. On OPEC’s basis, freight and insurance combined accounted for about 30% of the total delivered cost of a barrel of crude on this route, against about 5% in January. These are OPEC estimates of the cost borne by cargo, not tanker TCE earnings.
Chart 6. OPEC estimates for VLCC Middle East–East Asia freight and insurance costs, and their share of total delivered cost, weeks of 26 January and 26 October 2026.Source: OPEC, Who gets what from shipping crude oil?, November 2026.
Hormuz Freight Watch: Macro Risks
Conditions around the Strait of Hormuz remained uncertain in early November. Diplomatic contacts continued without a confirmed agreement, and security incidents involving commercial vessels were reported in and around the strait during the week. For shipping, the practical effects are on owners’ willingness to accept Gulf employment, war-risk insurance terms and voyage times, none of which can be assumed to normalise on a fixed timetable. Oil prices fell sharply after the US midterm elections amid hopes of de-escalation, while TD22 declined 16.3% between 3 and 6 November; the freight data do not isolate the effect of the election from other market changes.
Transport costs remain elevated, with freight and insurance at about 30% of total delivered cost on Middle East–East Asia VLCC voyages on OPEC’s estimates. Seven OPEC+ producers maintained their December production targets on 1 November, leaving planned supply levels unchanged ahead of their next meeting on 29 November. Potential changes to tanker availability and export capacity remain unconfirmed: the approval process outlined on 19 October for acquiring and refurbishing sanctioned tankers has yet to result in confirmed additions to mainstream chartering capacity, while comments attributed to Saudi Arabia’s energy minister on 12 October indicated that converting a gas pipeline could add about 1.2 million b/d of crude capacity towards the Red Sea within seven to eight weeks; completion has not been confirmed, and Yanbu loading capacity remains a constraint.
Market Takeaways
The tanker freight outlook remains difficult to assess, with geopolitical developments continuing to influence market expectations and vessel employment. Fresh reports of a possible agreement concerning the Strait of Hormuz on 9 November have renewed attention on the prospects for de-escalation, although no agreement or corresponding improvement in shipping conditions has been confirmed.
In the Atlantic, the timing of ballast arrivals and fresh cargo enquiry will be important in determining the supply balance for upcoming loadings. The Middle East Gulf presents a different picture, where security concerns, insurance costs and owners’ willingness to trade continue to influence vessel availability. An increase in vessel transits would not, on its own, establish that normal chartering conditions have been restored. With these differences persisting, the timing and scale of any freight adjustment remain uncertain.
Disclaimer: This report has been prepared by Signal Group for general information purposes only. It does not constitute, and should not be relied upon as, investment, financial, trading, legal or commercial advice, or as a recommendation to enter into any transaction. While reasonable efforts have been made to ensure the information is accurate and reliable at the date of publication, no representation or warranty, express or implied, is given as to its accuracy, completeness or continued availability. Certain figures may be estimates or provisional and may subsequently be revised. Market conditions and other external factors may change without notice and may not be reflected in this report. Readers should conduct their own assessment and seek appropriate professional advice before making any decision. To the fullest extent permitted by law, Signal Group accepts no liability for any loss or damage arising from the use of, or reliance on, this report.
Maria holds a M.Sc. in Shipping, Trade and Finance from the Bayes Business School at the City University in London and a B.Sc. in Shipping Economics from the University of Piraeus.
Creating a sustainable world requires us to embark on a journey towards a zero emission future, where every step is a commitment to preserve our planet for future generations.
Albert Greenway
Environmental Scientist, Sustainability Expert
No items found.
Increased Use of Renewable Energy:
Shipping companies are embracing renewable energy sources to power onboard systems and reduce emissions during port operations. Solar panels and wind turbines are being installed on vessels to generate clean energy, reducing reliance on auxiliary engines, and cutting down emissions. Shore power facilities in ports allow ships to connect to the electrical grid, eliminating the need for onboard generators while docked.
Collaboration and Industry Partnerships:
Recognizing that addressing emissions requires collective action, shipping companies, governments, and organizations have formed partnerships and collaborations. These initiatives focus on research and development, sharing best practices, and promoting knowledge transfer. Joint projects aim to develop and deploy innovative technologies, improve infrastructure, and create a supportive regulatory framework to accelerate the industry's transition towards a greener future. The Zero Emission Shipping - Mission Innovation.
To pave the way for a greener future in shipping, the availability of alternative fuels plays a vital role in their widespread adoption. However, this availability is influenced by factors such as port infrastructure, local regulations, and government policies. As the demand for cleaner fuels in shipping rises and environmental regulations become more stringent, efforts are underway to improve the accessibility of these fuels through infrastructure development, collaborations, and investments in production facilities.
Liquefied Natural Gas (LNG) infrastructure has seen significant growth in recent years, resulting in more LNG bunkering facilities and LNG-powered vessels. Nonetheless, the availability of LNG as a marine fuel can still vary depending on the region. To ensure consistent availability worldwide, there is a need for further development of LNG supply chains and infrastructure. For biofuels, their availability hinges on production capacity and the availability of feedstock. Although biofuels are being produced and utilized in various sectors, their availability as a marine fuel remains limited. Scaling up biofuel production and establishing robust supply chains are imperative to ensure wider availability within the shipping industry.Hydrogen, as a fuel for maritime applications, is still in the early stages of infrastructure development. While some hydrogen vessels have been tested or introduced in the first quarter of last year, the infrastructure required for hydrogen production and distribution needs further advancement.
Ammonia, as a marine fuel, currently faces limitations in availability. The production, storage, and handling infrastructure for ammonia need further development to support its widespread use in the shipping industry.Methanol, on the other hand, is already a commercially available fuel and has been used as a blend with conventional fuels in some ships. However, its availability as a standalone marine fuel can still be limited in certain regions. Bureau Veritas in October 2022 published a White Paper for the Alternative Fuels Outlook. This white paper provides a comprehensive overview of alternative fuels for the shipping industry, taking into account key factors such as technological maturity, availability, safety, emissions, and regulations.
Creating a sustainable world requires us to embark on a journey towards a zero emission future, where every step is a commitment to preserve our planet for future generations.
Albert Greenway
Environmental Scientist, Sustainability Expert
Increased Use of Renewable Energy:
Shipping companies are embracing renewable energy sources to power onboard systems and reduce emissions during port operations. Solar panels and wind turbines are being installed on vessels to generate clean energy, reducing reliance on auxiliary engines, and cutting down emissions. Shore power facilities in ports allow ships to connect to the electrical grid, eliminating the need for onboard generators while docked.
Collaboration and Industry Partnerships:
Recognizing that addressing emissions requires collective action, shipping companies, governments, and organizations have formed partnerships and collaborations. These initiatives focus on research and development, sharing best practices, and promoting knowledge transfer. Joint projects aim to develop and deploy innovative technologies, improve infrastructure, and create a supportive regulatory framework to accelerate the industry's transition towards a greener future. The Zero Emission Shipping - Mission Innovation.
To pave the way for a greener future in shipping, the availability of alternative fuels plays a vital role in their widespread adoption. However, this availability is influenced by factors such as port infrastructure, local regulations, and government policies. As the demand for cleaner fuels in shipping rises and environmental regulations become more stringent, efforts are underway to improve the accessibility of these fuels through infrastructure development, collaborations, and investments in production facilities.
Liquefied Natural Gas (LNG) infrastructure has seen significant growth in recent years, resulting in more LNG bunkering facilities and LNG-powered vessels. Nonetheless, the availability of LNG as a marine fuel can still vary depending on the region. To ensure consistent availability worldwide, there is a need for further development of LNG supply chains and infrastructure. For biofuels, their availability hinges on production capacity and the availability of feedstock. Although biofuels are being produced and utilized in various sectors, their availability as a marine fuel remains limited. Scaling up biofuel production and establishing robust supply chains are imperative to ensure wider availability within the shipping industry.Hydrogen, as a fuel for maritime applications, is still in the early stages of infrastructure development. While some hydrogen vessels have been tested or introduced in the first quarter of last year, the infrastructure required for hydrogen production and distribution needs further advancement.
Ammonia, as a marine fuel, currently faces limitations in availability. The production, storage, and handling infrastructure for ammonia need further development to support its widespread use in the shipping industry.Methanol, on the other hand, is already a commercially available fuel and has been used as a blend with conventional fuels in some ships. However, its availability as a standalone marine fuel can still be limited in certain regions. Bureau Veritas in October 2022 published a White Paper for the Alternative Fuels Outlook. This white paper provides a comprehensive overview of alternative fuels for the shipping industry, taking into account key factors such as technological maturity, availability, safety, emissions, and regulations.